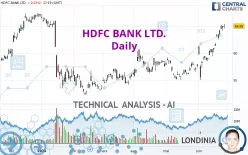
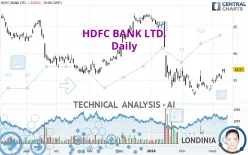
HDFC BANK LTD.
18.15
USD
(+1.40%)
04/30/2025 - 15:34
Closed 15 min delayed data - NYSE Stocks
| Open: | 17.90 |
| Change: | +0.25 |
| Volume: | 776 |
| Low: | 17.80 |
| High: | 18.25 |
| High / Low range: | 0.45 |
| Type: | Stocks |
| Ticker: | HDB |
| ISIN: |
HDFC BANK LTD. Technical Analyses
To filter analyses please use our advanced search feature.
HDFC BANK LTD. - More technical analyses...
HDFC BANK LTD. - More technical analyses...
- 0
- 94.5k
- 15.8k
- 0

Status : INVALID
Simple chart
- 04/21/2025 - 15:35
- 65
- 0
- 0
- 0
- 94.5k
- 15.8k
- 0

Status : NEUTRAL
Simple chart
- 04/08/2025 - 19:45
- 121
- 0
- 0
- 0
- 94.5k
- 15.8k
- 0

Status : TARGET REACHED
Simple chart
- 03/26/2025 - 14:20
- 107
- 0
- 0
- 0
- 94.5k
- 15.8k
- 0
Status : INVALID
Simple chart
- 06/27/2024 - 17:35
- 199
- 0
- 0
- 0
- 94.5k
- 15.8k
- 0
Status : NEUTRAL
Simple chart
- 03/13/2024 - 19:25
- 469
- 0
- 0
- 0
- 94.5k
- 15.8k
- 0

Status : TARGET REACHED
Simple chart
- 10/04/2019 - 10:40
- 350
- 0
- 1

