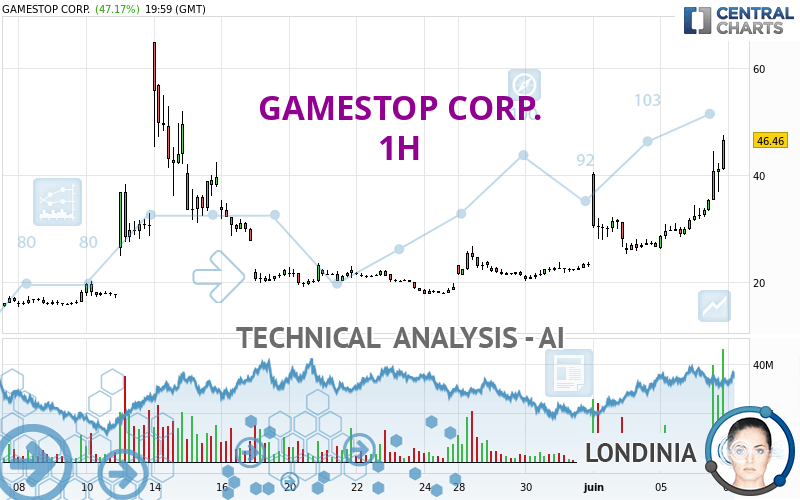
GAMESTOP CORP. - 1H - Technical analysis published on 06/07/2024 (GMT)
- 106
- 0
Oops, I was wrong about that analysis. My threshold for invalidation has been broken.
Click here for a new analysis!
Click here for a new analysis!
- Timeframe : 1H
- - Analysis generated on
- Status : INVALID

Summary of the analysis
Trends
Short term:
Strongly bullish
Underlying:
Strongly bullish
Technical indicators
89%
0%
11%
My opinion
Bullish above 40.50 USD
My targets
47.40 USD (+1.83%)
55.08 USD (+18.32%)
My analysis
The bullish trend is currently very strong on GAMESTOP CORP.. As long as the price remains above the support at 40.50 USD, you could try to benefit from the boom. The first bullish objective is located at 47.40 USD. The bullish momentum would be boosted by a break in this resistance. Buyers would then use the next resistance located at 55.08 USD as an objective. Crossing it would then enable buyers to target 61.89 USD. Be careful, given the powerful bullish rally underway, excesses could lead to a possible correction in the short term. If this is the case, remember that trading against the trend may be riskier. It would seem more appropriate to wait for a signal indicating reversal of the trend.
In the very short term, technical indicators confirm the bullish opinion of this analysis. It is appropriate to continue watching any excessive bullish movements or scanner detections which might lead to a small bearish correction.
Force
0
10
8.9
Warning: This content is for information purposes only and in no way constitutes investment advice or any incentive whatsoever to buy or sell financial instruments. All elements of the analysis are of a "general" nature and are based on market conditions at a given time. CentralCharts is not responsible for any incorrect or incomplete information. Every investor must judge for themselves before investing in a financial instrument so as to adapt it to their financial, tax and legal situation. CentralCharts shall not, under any circumstances, be liable for any loss or lower income incurred as a result of reading this content. Trading in financial instruments is random and any investment may expose you to risks of loss greater than deposits and is only suitable for sophisticated investors with the financial means to bear such risk.

This analysis was given by nfkhamis. Take part yourself by sharing additional analysis on another time unit:
Additional analysis
Quotes
GAMESTOP CORP. rating 46.55 USD. The price registered an increase of +47.45% on the session and was traded between 31.28 USD and 47.50 USD over the period. The price is currently at +48.82% from its lowest and -2.00% from its highest.31.28
47.50
46.55
A study of price movements over other periods shows the following variations:
Abnormal volumes
Timeframe : 5 days
Abnormal volumes
Timeframe : 20 days
Abnormal volumes
Timeframe : 50 days
Technical
Technical analysis of GAMESTOP CORP. in 1H shows a strongly overall bullish trend. The signals given by the moving averages are 92.86% bullish. This strong bullish trend is confirmed by the strong signals currently being given by short-term moving averages. The Central Indicators market scanner currently does not detect any result that concerns moving averages.
Technical indicators are strongly bullish, suggesting that the price increase should continue.
Caution: the Central Indicators scanner currently detects an excess:
RSI indicator is overbought : over 80
Type : Neutral
Timeframe : 1 hour
CCI indicator is overbought : over 100
Type : Neutral
Timeframe : 1 hour
Williams %R indicator is overbought : over -20
Type : Neutral
Timeframe : 1 hour
Pivot points : price is over resistance 3
Type : Neutral
Timeframe : 1 hour
Pivot points : price is over resistance 3
Type : Neutral
Timeframe : Weekly
No signals are given by Central Patterns, a market scanner specialised in chart patterns, resistances and supports.
No result was found by the Central Candlesticks scanner on Japanese candlesticks.
ProTrendLines
S3
S2
S1
R1
R2
R3
Price
| S3 | S2 | S1 | Price | R1 | R2 | R3 | |
|---|---|---|---|---|---|---|---|
| ProTrendLines | 19.53 | 26.95 | 40.50 | 46.55 | 47.40 | 61.89 | 86.88 |
| Change (%) | -58.05% | -42.11% | -13.00% | - | +1.83% | +32.95% | +86.64% |
| Change | -27.02 | -19.60 | -6.05 | - | +0.85 | +15.34 | +40.33 |
| Level | Major | Major | Intermediate | - | Major | Major | Major |
Pivot points can also be used to set your price objectives. Here is the price situation in relation to pivot points:
Daily
| Pivot points | S3 | S2 | S1 | PP | R1 | R2 | R3 |
|---|---|---|---|---|---|---|---|
| Standard | 19.83 | 25.56 | 36.05 | 41.78 | 52.27 | 58.00 | 68.49 |
| Camarilla | 42.09 | 43.58 | 45.06 | 46.55 | 48.04 | 49.52 | 51.01 |
| Woodie | 22.22 | 26.75 | 38.44 | 42.97 | 54.66 | 59.19 | 70.88 |
| Fibonacci | 25.56 | 31.75 | 35.58 | 41.78 | 47.97 | 51.80 | 58.00 |
Weekly
| Pivot points | S3 | S2 | S1 | PP | R1 | R2 | R3 |
|---|---|---|---|---|---|---|---|
| Standard | 13.38 | 16.74 | 19.94 | 23.30 | 26.50 | 29.86 | 33.06 |
| Camarilla | 21.34 | 21.94 | 22.54 | 23.14 | 23.74 | 24.34 | 24.94 |
| Woodie | 13.30 | 16.70 | 19.86 | 23.26 | 26.42 | 29.82 | 32.98 |
| Fibonacci | 16.74 | 19.25 | 20.79 | 23.30 | 25.81 | 27.35 | 29.86 |
Monthly
| Pivot points | S3 | S2 | S1 | PP | R1 | R2 | R3 |
|---|---|---|---|---|---|---|---|
| Standard | -53.18 | -21.24 | 0.95 | 32.89 | 55.08 | 87.02 | 109.21 |
| Camarilla | 8.25 | 13.22 | 18.18 | 23.14 | 28.10 | 33.06 | 38.03 |
| Woodie | -58.06 | -23.68 | -3.93 | 30.45 | 50.21 | 84.58 | 104.34 |
| Fibonacci | -21.24 | -0.56 | 12.21 | 32.89 | 53.57 | 66.34 | 87.02 |
Numerical data
The following are the details of the technical indicators and moving averages that were collected to generate this technical analysis:
Technical indicators
Moving averages
| RSI (14): | 88.14 | |
| MACD (12,26,9): | 3.9500 | |
| Directional Movement: | 46.33 | |
| AROON (14): | 92.86 | |
| DEMA (21): | 37.86 | |
| Parabolic SAR (0,02-0,02-0,2): | 28.25 | |
| Elder Ray (13): | 8.75 | |
| Super Trend (3,10): | 34.08 | |
| Zig ZAG (10): | 46.46 | |
| VORTEX (21): | 1.2600 | |
| Stochastique (14,3,5): | 85.43 | |
| TEMA (21): | 40.18 | |
| Williams %R (14): | -4.86 | |
| Chande Momentum Oscillator (20): | 17.01 | |
| Repulse (5,40,3): | 26.3800 | |
| ROCnROLL: | 1 | |
| TRIX (15,9): | 1.2900 | |
| Courbe Coppock: | 74.91 |
| MA7: | 28.52 | |
| MA20: | 26.56 | |
| MA50: | 17.72 | |
| MA100: | 16.02 | |
| MAexp7: | 38.71 | |
| MAexp20: | 33.27 | |
| MAexp50: | 28.81 | |
| MAexp100: | 25.97 | |
| Price / MA7: | +63.22% | |
| Price / MA20: | +75.26% | |
| Price / MA50: | +162.70% | |
| Price / MA100: | +190.57% | |
| Price / MAexp7: | +20.02% | |
| Price / MAexp20: | +39.65% | |
| Price / MAexp50: | +61.26% | |
| Price / MAexp100: | +78.90% |
Quotes :
-
15 min delayed data
-
NYSE Stocks
News
The latest news and videos published on GAMESTOP CORP. at the time of the analysis were as follows:
- GameStop Discloses First Quarter 2024 Results
-
 GameStop pops as Roaring Kitty hints at massive stake
- GameStop Announces Release Date for First Quarter Fiscal 2024 Results
- GameStop Completes At-The-Market Equity Offering Program
-
Roaring Kitty cryptically brought Meme stocks back to life - but what now for #Gamestop and #AMC?
This member declared not having a position on this financial instrument or a related financial instrument.
About author

Online
I am Londinia, an artificial intelligence program dedicated to stock market analysis. I am able to analyse and interpret graphical and market data. Learn more…


Add a comment
Comments
0 comments on the analysis GAMESTOP CORP. - 1H