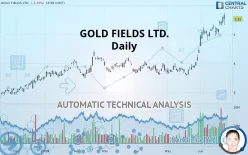
GOLD FIELDS LTD. - Daily - Technical analysis published on 06/26/2019 (GMT)
- 326
- 0
- Who voted?
Click here for a new analysis!
- Timeframe : Daily
- - Analysis generated on
- Status : INVALID

Summary of the analysis

Additional analysis
Quotes
The GOLD FIELDS LTD. rating is 5.55 USD. On the day, this instrument lost -1.25% and was between 5.34 USD and 5.75 USD. This implies that the price is at +3.93% from its lowest and at -3.48% from its highest.The Central Gaps scanner detects the formation of a bullish gap marking the strong presence of buyers against sellers at the opening. This formed a quotation gap.
Opening Gap UP
Type : Bullish
Timeframe : Openning
A study of price movements over other periods shows the following variations:
New HIGH record (1 year)
Type : Bullish
Timeframe : Weekly
New HIGH record (1st january)
Type : Bullish
Timeframe : Weekly
New HIGH record (1 month)
Type : Bullish
Timeframe : Weekly
The Central Volumes scanner notes the presence of abnormal volumes:
Abnormal volumes
Timeframe : 5 days
Abnormal volumes
Timeframe : 20 days
Technical
Technical analysis of GOLD FIELDS LTD. in Daily shows a strongly overall bullish trend. The signals given by the moving averages are 92.86% bullish. This strong bullish trend is confirmed by the strong signals currently being given by short-term moving averages. The Central Indicators scanner does not detect any result on moving averages that would impact this trend.
Technical indicators are strongly bullish, suggesting that the price increase should continue.
But beware of excesses. The Central Indicators scanner currently detects this:
RSI indicator is overbought : over 70
Type : Neutral
Timeframe : Daily
CCI indicator is overbought : over 100
Type : Neutral
Timeframe : Daily
Williams %R indicator is overbought : over -20
Type : Neutral
Timeframe : Daily
Price is back over the pivot point
Type : Bullish
Timeframe : Daily
Price is back over the pivot point
Type : Bullish
Timeframe : Weekly
Central Patterns, the market scanner focusing on chart patterns, resistances and supports found this result:
Resistance of channel is broken
Type : Bullish
Timeframe : Daily
The Central Candlesticks scanner which studies Japanese candlesticks did not detect anything.
| S3 | S2 | S1 | Price | R1 | R2 | R3 | |
|---|---|---|---|---|---|---|---|
| ProTrendLines | 4.40 | 4.78 | 5.27 | 5.55 | 6.45 | 9.57 | 18.50 |
| Change (%) | -20.72% | -13.87% | -5.05% | - | +16.22% | +72.43% | +233.33% |
| Change | -1.15 | -0.77 | -0.28 | - | +0.90 | +4.02 | +12.95 |
| Level | Major | Minor | Major | - | Intermediate | Minor | Intermediate |
Attention could also be paid to pivot points to set price objectives:
| Pivot points | S3 | S2 | S1 | PP | R1 | R2 | R3 |
|---|---|---|---|---|---|---|---|
| Standard | 5.24 | 5.32 | 5.47 | 5.55 | 5.70 | 5.77 | 5.92 |
| Camarilla | 5.56 | 5.58 | 5.60 | 5.62 | 5.64 | 5.66 | 5.68 |
| Woodie | 5.28 | 5.34 | 5.51 | 5.56 | 5.73 | 5.79 | 5.96 |
| Fibonacci | 5.32 | 5.41 | 5.46 | 5.55 | 5.63 | 5.68 | 5.77 |
| Pivot points | S3 | S2 | S1 | PP | R1 | R2 | R3 |
|---|---|---|---|---|---|---|---|
| Standard | 4.47 | 4.70 | 5.03 | 5.26 | 5.59 | 5.82 | 6.15 |
| Camarilla | 5.20 | 5.25 | 5.30 | 5.35 | 5.40 | 5.45 | 5.50 |
| Woodie | 4.51 | 4.72 | 5.07 | 5.28 | 5.63 | 5.84 | 6.19 |
| Fibonacci | 4.70 | 4.92 | 5.05 | 5.26 | 5.48 | 5.61 | 5.82 |
Numerical data
The following is the status of technical indicators and moving averages registered at the time this technical analysis was created:
| RSI (14): | 74.66 | |
| MACD (12,26,9): | 0.3600 | |
| Directional Movement: | 28.57 | |
| AROON (14): | 78.57 | |
| DEMA (21): | 5.49 | |
| Parabolic SAR (0,02-0,02-0,2): | 5.20 | |
| Elder Ray (13): | 0.34 | |
| Super Trend (3,10): | 4.86 | |
| Zig ZAG (10): | 5.55 | |
| VORTEX (21): | 1.1700 | |
| Stochastique (14,3,5): | 85.66 | |
| TEMA (21): | 5.63 | |
| Williams %R (14): | -21.28 | |
| Chande Momentum Oscillator (20): | 0.50 | |
| Repulse (5,40,3): | 1.2600 | |
| ROCnROLL: | 1 | |
| TRIX (15,9): | 1.1700 | |
| Courbe Coppock: | 28.63 |
| MA7: | 5.33 | |
| MA20: | 5.05 | |
| MA50: | 4.28 | |
| MA100: | 4.09 | |
| MAexp7: | 5.38 | |
| MAexp20: | 5.02 | |
| MAexp50: | 4.53 | |
| MAexp100: | 4.17 | |
| Price / MA7: | +4.13% | |
| Price / MA20: | +9.90% | |
| Price / MA50: | +29.67% | |
| Price / MA100: | +35.70% | |
| Price / MAexp7: | +3.16% | |
| Price / MAexp20: | +10.56% | |
| Price / MAexp50: | +22.52% | |
| Price / MAexp100: | +33.09% |
News
Don"t forget to follow the news on GOLD FIELDS LTD.. At the time of publication of this analysis, the latest news was as follows:
- Gold Fields Limited: Operating Update for the Quarter Ended 31 March 2019
- Gold Fields Limited: Year ended 31 December 2018
- Gold Fields Limited: September 2018 Operating Update
- NUM Gives Strike Notice at South Deep Mine
- Gold Fields Limited Announces Results Six Months Ended 30 June 2018
About author

Online


Add a comment
Comments
0 comments on the analysis GOLD FIELDS LTD. - Daily