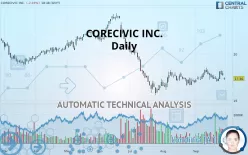
CORECIVIC INC. - Daily - Technical analysis published on 09/30/2019 (GMT)
- 236
- 0
- Who voted?
Click here for a new analysis!
- Timeframe : Daily
- - Analysis generated on
- Status : TARGET REACHED

Summary of the analysis

Additional analysis
Quotes
CORECIVIC INC. rating 17.36 USD. The price registered a decrease of -2.03% on the session and was traded between 17.19 USD and 17.49 USD over the period. The price is currently at +0.99% from its lowest and -0.74% from its highest.A bullish opening was detected by the Central Gaps scanner. Buyers are trying to impose a bullish momentum in the very short term.
Bullish opening
Type : Bullish
Timeframe : Openning
A study of price movements over other periods shows the following variations:
Technical
A technical analysis in Daily of this CORECIVIC INC. chart shows a slightly bearish trend. 53.57% of the signals given by moving averages are bearish. Caution: the strong bullish signals currently being given by short-term moving averages indicate that this slightly bearish trend could quickly be reversed. An assessment of moving averages reveals a bearish signal that could impact this trend:
Bearish trend reversal : adaptative moving average 50
Type : Bearish
Timeframe : Daily
In fact, only 7 technical indicators out of 18 studied are currently positioned bullish. Caution: the Central Indicators scanner currently detects an excess:
Williams %R indicator is overbought : over -20
Type : Neutral
Timeframe : Daily
Price is back over the pivot point
Type : Bullish
Timeframe : Weekly
Price is back under the pivot point
Type : Bearish
Timeframe : Daily
Williams %R indicator is back under -50
Type : Bearish
Timeframe : Daily
Central Patterns, the scanner specializing in chart patterns, did not identify any signals.
The Central Candlesticks scanner, specialised in Japanese candlesticks, did not identify any signals.
| S3 | S2 | S1 | Price | R1 | R2 | R3 | |
|---|---|---|---|---|---|---|---|
| ProTrendLines | 13.20 | 15.80 | 16.65 | 17.36 | 17.38 | 18.58 | 20.36 |
| Change (%) | -23.96% | -8.99% | -4.09% | - | +0.12% | +7.03% | +17.28% |
| Change | -4.16 | -1.56 | -0.71 | - | +0.02 | +1.22 | +3.00 |
| Level | Major | Intermediate | Major | - | Intermediate | Major | Minor |
Pivot points can also be used to set your price objectives. Here is the price situation in relation to pivot points:
| Pivot points | S3 | S2 | S1 | PP | R1 | R2 | R3 |
|---|---|---|---|---|---|---|---|
| Standard | 16.51 | 16.84 | 17.05 | 17.38 | 17.60 | 17.93 | 18.14 |
| Camarilla | 17.12 | 17.17 | 17.22 | 17.27 | 17.32 | 17.37 | 17.42 |
| Woodie | 16.45 | 16.81 | 17.00 | 17.35 | 17.54 | 17.90 | 18.09 |
| Fibonacci | 16.84 | 17.04 | 17.17 | 17.38 | 17.59 | 17.72 | 17.93 |
| Pivot points | S3 | S2 | S1 | PP | R1 | R2 | R3 |
|---|---|---|---|---|---|---|---|
| Standard | 15.52 | 16.06 | 16.67 | 17.21 | 17.82 | 18.36 | 18.97 |
| Camarilla | 16.95 | 17.06 | 17.17 | 17.27 | 17.38 | 17.48 | 17.59 |
| Woodie | 15.55 | 16.08 | 16.70 | 17.23 | 17.85 | 18.38 | 19.00 |
| Fibonacci | 16.06 | 16.50 | 16.77 | 17.21 | 17.65 | 17.92 | 18.36 |
| Pivot points | S3 | S2 | S1 | PP | R1 | R2 | R3 |
|---|---|---|---|---|---|---|---|
| Standard | 13.50 | 14.62 | 15.57 | 16.68 | 17.63 | 18.75 | 19.70 |
| Camarilla | 15.95 | 16.14 | 16.33 | 16.52 | 16.71 | 16.90 | 17.09 |
| Woodie | 13.42 | 14.58 | 15.49 | 16.64 | 17.55 | 18.71 | 19.62 |
| Fibonacci | 14.62 | 15.41 | 15.89 | 16.68 | 17.47 | 17.96 | 18.75 |
Numerical data
The following is the status of technical indicators and moving averages registered at the time this technical analysis was created:
| RSI (14): | 53.18 | |
| MACD (12,26,9): | 0.0600 | |
| Directional Movement: | 4.34 | |
| AROON (14): | -50.00 | |
| DEMA (21): | 17.20 | |
| Parabolic SAR (0,02-0,02-0,2): | 16.65 | |
| Elder Ray (13): | 0.16 | |
| Super Trend (3,10): | 16.37 | |
| Zig ZAG (10): | 17.33 | |
| VORTEX (21): | 1.0500 | |
| Stochastique (14,3,5): | 49.93 | |
| TEMA (21): | 17.37 | |
| Williams %R (14): | -48.85 | |
| Chande Momentum Oscillator (20): | -0.25 | |
| Repulse (5,40,3): | -0.6600 | |
| ROCnROLL: | -1 | |
| TRIX (15,9): | 0.0500 | |
| Courbe Coppock: | 0.48 |
| MA7: | 17.14 | |
| MA20: | 17.17 | |
| MA50: | 16.82 | |
| MA100: | 18.64 | |
| MAexp7: | 17.24 | |
| MAexp20: | 17.14 | |
| MAexp50: | 17.35 | |
| MAexp100: | 17.97 | |
| Price / MA7: | +1.28% | |
| Price / MA20: | +1.11% | |
| Price / MA50: | +3.21% | |
| Price / MA100: | -6.87% | |
| Price / MAexp7: | +0.70% | |
| Price / MAexp20: | +1.28% | |
| Price / MAexp50: | +0.06% | |
| Price / MAexp100: | -3.39% |
News
Don"t forget to follow the news on CORECIVIC INC.. At the time of publication of this analysis, the latest news was as follows:
- CORECIVIC INVESTIGATION INITIATED BY FORMER LOUISIANA ATTORNEY GENERAL: Kahn Swick & Foti, LLC Investigates the Officers and Directors of CoreCivic, Inc. - CXW
-
 CoreCivic
- CoreCivic Announces 2016 Fourth Quarter Earnings Release and Conference Call Dates
- CoreCivic Provides Tax Allocations of 2016 Dividend Distributions
- CoreCivic Awarded Management Contract at the Northeast Ohio Correctional Center
About author

Online


Add a comment
Comments
0 comments on the analysis CORECIVIC INC. - Daily