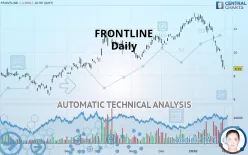
FRONTLINE PLC - Daily - Technical analysis published on 02/04/2020 (GMT)
- 328
- 0
- Who voted?
Click here for a new analysis!
- Timeframe : Daily
- - Analysis generated on
- Status : TARGET REACHED
Summary of the analysis

Additional analysis
Quotes
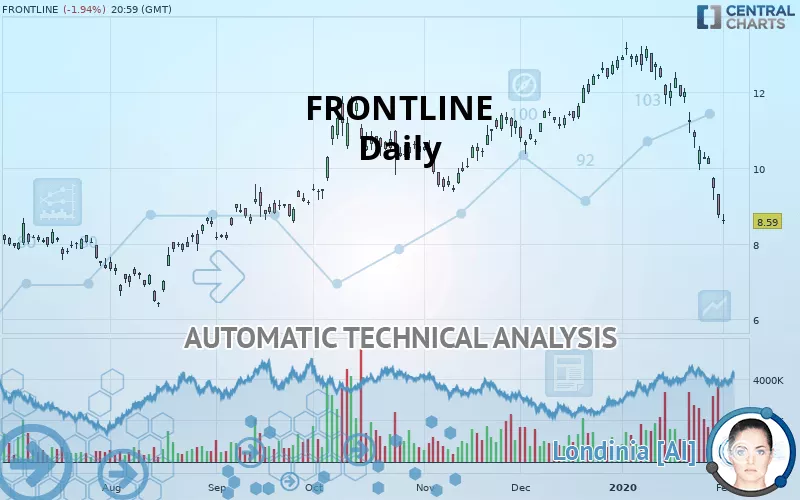
The FRONTLINE rating is 8.59 USD. The price is lower by -1.94% since the last closing and was traded between 8.53 USD and 8.78 USD over the period. The price is currently at +0.70% from its lowest and -2.16% from its highest.The Central Gaps scanner detects the formation of a bearish gap marking the strong presence of sellers ahead of buyers at the opening. This formed a quotation gap.
Opening Gap DOWN
Type : Bearish
Timeframe : Openning
So that you have an overall view of the price change, here is a table showing the variations over several periods:
Abnormal volumes
Timeframe : 5 days
Abnormal volumes
Timeframe : 20 days
Technical
Technical analysis of this Daily chart of FRONTLINE indicates that the overall trend is bearish. The signals given by moving averages are 78.57% bearish. This bearish trend is reinforced by the strong signals currently being given by short-term moving averages. The Central Indicators scanner detects a bearish signal on moving averages that could impact this trend:
Bearish trend reversal : Moving Average 100
Type : Bearish
Timeframe : Daily
In fact, 12 technical indicators on 18 studied are currently positioned bearish. But beware of excesses. The Central Indicators scanner currently detects this:
RSI indicator is oversold : under 30
Type : Neutral
Timeframe : Daily
CCI indicator is oversold : under -100
Type : Neutral
Timeframe : Daily
CCI indicator: bullish divergence
Type : Bullish
Timeframe : Daily
Williams %R indicator is oversold : under -80
Type : Neutral
Timeframe : Daily
Price is back under the pivot point
Type : Bearish
Timeframe : Daily
Price is back under the pivot point
Type : Bearish
Timeframe : Weekly
The analysis of the price chart with Central Patterns scanners does not return any result.
The Central Candlesticks scanner which studies Japanese candlesticks did not detect anything.
| S3 | S2 | S1 | Price | R1 | R2 | R3 | |
|---|---|---|---|---|---|---|---|
| ProTrendLines | 4.89 | 6.09 | 7.22 | 8.59 | 8.78 | 9.48 | 10.26 |
| Change (%) | -43.07% | -29.10% | -15.95% | - | +2.21% | +10.36% | +19.44% |
| Change | -3.70 | -2.50 | -1.37 | - | +0.19 | +0.89 | +1.67 |
| Level | Minor | Major | Intermediate | - | Major | Intermediate | Intermediate |
Pivot points can also be used to set your price objectives. Here is the price situation in relation to pivot points:
| Pivot points | S3 | S2 | S1 | PP | R1 | R2 | R3 |
|---|---|---|---|---|---|---|---|
| Standard | 7.90 | 8.29 | 8.53 | 8.92 | 9.16 | 9.55 | 9.79 |
| Camarilla | 8.59 | 8.64 | 8.70 | 8.76 | 8.82 | 8.88 | 8.93 |
| Woodie | 7.82 | 8.25 | 8.45 | 8.88 | 9.08 | 9.51 | 9.71 |
| Fibonacci | 8.29 | 8.53 | 8.68 | 8.92 | 9.16 | 9.31 | 9.55 |
| Pivot points | S3 | S2 | S1 | PP | R1 | R2 | R3 |
|---|---|---|---|---|---|---|---|
| Standard | 6.22 | 7.45 | 8.11 | 9.34 | 10.00 | 11.23 | 11.89 |
| Camarilla | 8.24 | 8.41 | 8.59 | 8.76 | 8.93 | 9.11 | 9.28 |
| Woodie | 5.93 | 7.31 | 7.82 | 9.20 | 9.71 | 11.09 | 11.60 |
| Fibonacci | 7.45 | 8.18 | 8.62 | 9.34 | 10.07 | 10.51 | 11.23 |
| Pivot points | S3 | S2 | S1 | PP | R1 | R2 | R3 |
|---|---|---|---|---|---|---|---|
| Standard | 2.55 | 5.62 | 7.19 | 10.26 | 11.83 | 14.90 | 16.47 |
| Camarilla | 7.48 | 7.91 | 8.34 | 8.76 | 9.19 | 9.61 | 10.04 |
| Woodie | 1.80 | 5.25 | 6.44 | 9.89 | 11.08 | 14.53 | 15.72 |
| Fibonacci | 5.62 | 7.39 | 8.49 | 10.26 | 12.03 | 13.13 | 14.90 |
Numerical data
The following are the details of the technical indicators and moving averages that were collected to generate this technical analysis:
| RSI (14): | 21.07 | |
| MACD (12,26,9): | -0.7500 | |
| Directional Movement: | -39.21 | |
| AROON (14): | -100.00 | |
| DEMA (21): | 10.13 | |
| Parabolic SAR (0,02-0,02-0,2): | 10.42 | |
| Elder Ray (13): | -1.78 | |
| Super Trend (3,10): | 10.29 | |
| Zig ZAG (10): | 8.59 | |
| VORTEX (21): | 0.5400 | |
| Stochastique (14,3,5): | 3.83 | |
| TEMA (21): | 9.27 | |
| Williams %R (14): | -98.56 | |
| Chande Momentum Oscillator (20): | -3.34 | |
| Repulse (5,40,3): | -7.6200 | |
| ROCnROLL: | 2 | |
| TRIX (15,9): | -0.3700 | |
| Courbe Coppock: | 45.59 |
| MA7: | 9.78 | |
| MA20: | 11.47 | |
| MA50: | 11.55 | |
| MA100: | 10.72 | |
| MAexp7: | 9.70 | |
| MAexp20: | 10.89 | |
| MAexp50: | 11.19 | |
| MAexp100: | 10.63 | |
| Price / MA7: | -12.17% | |
| Price / MA20: | -25.11% | |
| Price / MA50: | -25.63% | |
| Price / MA100: | -19.87% | |
| Price / MAexp7: | -11.44% | |
| Price / MAexp20: | -21.12% | |
| Price / MAexp50: | -23.24% | |
| Price / MAexp100: | -19.19% |
News
The latest news and videos published on FRONTLINE at the time of the analysis were as follows:
- FRO - Q3 2019 Presentation
- FRO - Third Quarter and Nine Months 2019 Results
- FRO - Invitation to Q3 2019 Results Conference Call and Webcast
- FRO - Extension of Senior Unsecured revolving $275.0 Million Credit Facility to May 2021
- FRO - FMSI Business Combined
About author

Online


Add a comment
Comments
0 comments on the analysis FRONTLINE PLC - Daily