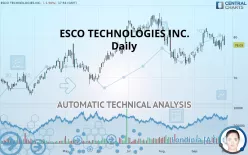
ESCO TECHNOLOGIES INC. - Daily - Technical analysis published on 10/01/2019 (GMT)
- 265
- 0
- Who voted?
- Timeframe : Daily
- - Analysis generated on
- Status : NEUTRAL

Summary of the analysis

Additional analysis
Quotes
ESCO TECHNOLOGIES INC. rating 78.05 USD. The price is lower by -1.90% since the last closing and was traded between 77.92 USD and 80.35 USD over the period. The price is currently at +0.17% from its lowest and -2.86% from its highest.The Central Gaps scanner detects a bullish opening marking the presence of buyers ahead of sellers at the opening but not sufficiently marked to allow the price to register a quotation gap.
Bullish opening
Type : Bullish
Timeframe : Openning
So that you have an overall view of the price change, here is a table showing the variations over several periods:
Technical
Technical analysis of this Daily chart of ESCO TECHNOLOGIES INC. indicates that the overall trend is slightly bullish. 60.71% of the signals given by moving averages are bullish. Caution: the slightly bearish signals currently given by short-term moving averages indicate that this slightly bullish trend could be reversed. The Central Indicators market scanner is currently detecting several bullish signals that could impact this trend:
Moving Average bullish crossovers : MA20 & MA50
Type : Bullish
Timeframe : Daily
Bullish price crossover with Moving Average 20
Type : Bullish
Timeframe : Daily
Bullish price crossover with Moving Average 50
Type : Bullish
Timeframe : Daily
Bullish price crossover with adaptative moving average 20
Type : Bullish
Timeframe : Daily
Bullish price crossover with adaptative moving average 50
Type : Bullish
Timeframe : Daily
In fact, Central Analyzer took into account 18 technical indicators and the result was as follows: 2 are bullish, 10 are neutral and 6 are bearish. Central Indicators, the detector scanner for these technical indicators has recently detected several signals:
Pivot points : price is under support 3
Type : Neutral
Timeframe : Daily
Parabolic SAR indicator bullish reversal
Type : Bullish
Timeframe : Daily
Price is back over the pivot point
Type : Bullish
Timeframe : Weekly
Williams %R indicator is back over -50
Type : Bullish
Timeframe : Daily
No signals are given by Central Patterns, a market scanner specialised in chart patterns, resistances and supports.
The Central Candlesticks scanner, specialised in Japanese candlesticks, did not identify any signals.
| S3 | S2 | S1 | Price | R1 | R2 | |
|---|---|---|---|---|---|---|
| ProTrendLines | 69.55 | 73.50 | 76.74 | 78.05 | 81.42 | 85.16 |
| Change (%) | -10.89% | -5.83% | -1.68% | - | +4.32% | +9.11% |
| Change | -8.50 | -4.55 | -1.31 | - | +3.37 | +7.11 |
| Level | Minor | Intermediate | Major | - | Major | Major |
To determine price objectives, it is also possible to use the pivot points. Here is the price position in relation to pivot points:
| Pivot points | S3 | S2 | S1 | PP | R1 | R2 | R3 |
|---|---|---|---|---|---|---|---|
| Standard | 77.18 | 78.04 | 78.80 | 79.65 | 80.41 | 81.27 | 82.03 |
| Camarilla | 79.12 | 79.26 | 79.41 | 79.56 | 79.71 | 79.86 | 80.00 |
| Woodie | 77.14 | 78.01 | 78.75 | 79.63 | 80.37 | 81.24 | 81.98 |
| Fibonacci | 78.04 | 78.65 | 79.04 | 79.65 | 80.27 | 80.65 | 81.27 |
| Pivot points | S3 | S2 | S1 | PP | R1 | R2 | R3 |
|---|---|---|---|---|---|---|---|
| Standard | 74.07 | 75.35 | 76.97 | 78.25 | 79.86 | 81.14 | 82.76 |
| Camarilla | 77.78 | 78.05 | 78.32 | 78.58 | 78.85 | 79.11 | 79.38 |
| Woodie | 74.24 | 75.44 | 77.13 | 78.33 | 80.03 | 81.23 | 82.92 |
| Fibonacci | 75.35 | 76.46 | 77.14 | 78.25 | 79.35 | 80.04 | 81.14 |
| Pivot points | S3 | S2 | S1 | PP | R1 | R2 | R3 |
|---|---|---|---|---|---|---|---|
| Standard | 66.96 | 70.57 | 75.07 | 78.68 | 83.18 | 86.79 | 91.29 |
| Camarilla | 77.33 | 78.07 | 78.82 | 79.56 | 80.30 | 81.05 | 81.79 |
| Woodie | 67.40 | 70.79 | 75.51 | 78.90 | 83.62 | 87.01 | 91.73 |
| Fibonacci | 70.57 | 73.67 | 75.59 | 78.68 | 81.78 | 83.70 | 86.79 |
Numerical data
The following is the status of technical indicators and moving averages registered at the time this technical analysis was created:
| RSI (14): | 51.08 | |
| MACD (12,26,9): | 0.2700 | |
| Directional Movement: | 1.16 | |
| AROON (14): | -71.42 | |
| DEMA (21): | 79.01 | |
| Parabolic SAR (0,02-0,02-0,2): | 76.64 | |
| Elder Ray (13): | 0.75 | |
| Super Trend (3,10): | 76.21 | |
| Zig ZAG (10): | 78.58 | |
| VORTEX (21): | 1.0500 | |
| Stochastique (14,3,5): | 42.26 | |
| TEMA (21): | 79.31 | |
| Williams %R (14): | -60.72 | |
| Chande Momentum Oscillator (20): | -2.40 | |
| Repulse (5,40,3): | -1.8500 | |
| ROCnROLL: | -1 | |
| TRIX (15,9): | 0.0700 | |
| Courbe Coppock: | 0.35 |
| MA7: | 78.56 | |
| MA20: | 78.93 | |
| MA50: | 78.59 | |
| MA100: | 77.55 | |
| MAexp7: | 78.84 | |
| MAexp20: | 78.57 | |
| MAexp50: | 78.30 | |
| MAexp100: | 77.02 | |
| Price / MA7: | -0.65% | |
| Price / MA20: | -1.11% | |
| Price / MA50: | -0.69% | |
| Price / MA100: | +0.64% | |
| Price / MAexp7: | -1.00% | |
| Price / MAexp20: | -0.66% | |
| Price / MAexp50: | -0.32% | |
| Price / MAexp100: | +1.34% |
News
The last news published on ESCO TECHNOLOGIES INC. at the time of the generation of this analysis was as follows:
- ESCO Announces New Credit Facility
- ESCO Announces Third Quarter Fiscal 2019 Results
- ESCO Technologies Announces Webcast of Third Quarter 2019 Conference Call
- ESCO Announces Acquisition of Navy Submarine Supplier
- ESCO Announces Second Quarter Fiscal 2019 Results
About author

Online


Add a comment
Comments
0 comments on the analysis ESCO TECHNOLOGIES INC. - Daily