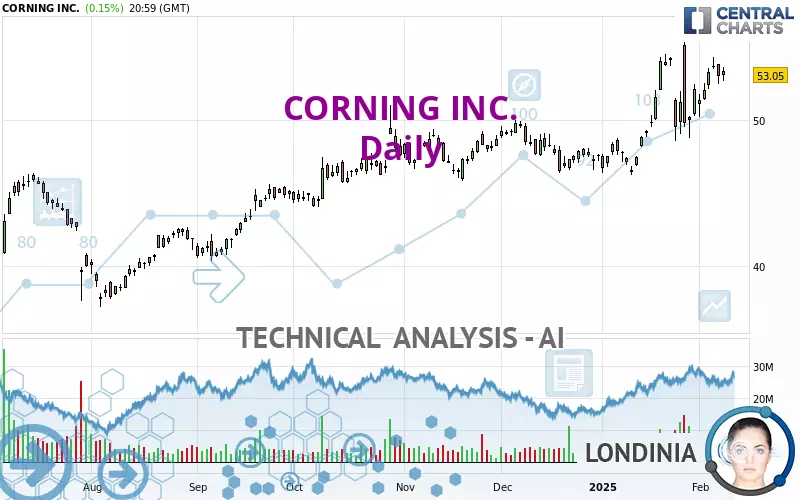
CORNING INC. - Daily - Technical analysis published on 02/11/2025 (GMT)
- 95
- 0
- Timeframe : Daily
- - Analysis generated on
- Status : IN PROGRESS...

Summary of the analysis

Additional analysis
Quotes
The CORNING INC. price is 53.05 USD. The price registered an increase of +0.15% on the session with the lowest point at 52.65 USD and the highest point at 53.60 USD. The deviation from the price is +0.76% for the low point and -1.03% for the high point.The Central Gaps scanner detects a bullish opening marking the presence of buyers ahead of sellers at the opening but not sufficiently marked to allow the price to register a quotation gap.
Bullish opening
Type : Bullish
Timeframe : Openning
So that you have an overall view of the price change, here is a table showing the variations over several periods:
Near a new HIGH record (5 years)
Type : Bullish
Timeframe : Weekly
Near a new HIGH record (1 year)
Type : Bullish
Timeframe : Weekly
Near a new HIGH record (1st january)
Type : Bullish
Timeframe : Weekly
Near a new HIGH record (1 month)
Type : Bullish
Timeframe : Weekly
Technical
Technical analysis of this Daily chart of CORNING INC. indicates that the overall trend is strongly bullish. The signals given by the moving averages are 92.86% bullish. This strong bullish trend is confirmed by the strong signals currently being given by short-term moving averages. The Central Indicators scanner does not detect any result on moving averages that would impact this trend.
In fact, according to the parameters integrated into the Central Analyzer system, 11 technical indicators out of 18 analysed are currently bullish. Central Indicators, the scanner specialised in technical indicators, has identified this signal:
Price is back under the pivot point
Type : Bearish
Timeframe : Daily
No signals are given by Central Patterns, a market scanner specialised in chart patterns, resistances and supports.
The Central Candlesticks scanner, specialised in Japanese candlesticks, did not identify any signals.
| S3 | S2 | S1 | Price | R1 | |
|---|---|---|---|---|---|
| ProTrendLines | 43.85 | 46.50 | 49.76 | 53.05 | 54.25 |
| Change (%) | -17.34% | -12.35% | -6.20% | - | +2.26% |
| Change | -9.20 | -6.55 | -3.29 | - | +1.20 |
| Level | Minor | Major | Intermediate | - | Major |
Pivot points can also be used to set your price objectives. Here is the price situation in relation to pivot points:
| Pivot points | S3 | S2 | S1 | PP | R1 | R2 | R3 |
|---|---|---|---|---|---|---|---|
| Standard | 51.65 | 52.15 | 52.60 | 53.10 | 53.55 | 54.05 | 54.50 |
| Camarilla | 52.79 | 52.88 | 52.96 | 53.05 | 53.14 | 53.22 | 53.31 |
| Woodie | 51.63 | 52.14 | 52.58 | 53.09 | 53.53 | 54.04 | 54.48 |
| Fibonacci | 52.15 | 52.51 | 52.74 | 53.10 | 53.46 | 53.69 | 54.05 |
| Pivot points | S3 | S2 | S1 | PP | R1 | R2 | R3 |
|---|---|---|---|---|---|---|---|
| Standard | 46.52 | 48.34 | 50.66 | 52.48 | 54.80 | 56.62 | 58.94 |
| Camarilla | 51.83 | 52.21 | 52.59 | 52.97 | 53.35 | 53.73 | 54.11 |
| Woodie | 46.76 | 48.47 | 50.90 | 52.61 | 55.04 | 56.75 | 59.18 |
| Fibonacci | 48.34 | 49.93 | 50.90 | 52.48 | 54.07 | 55.04 | 56.62 |
| Pivot points | S3 | S2 | S1 | PP | R1 | R2 | R3 |
|---|---|---|---|---|---|---|---|
| Standard | 37.93 | 42.06 | 47.07 | 51.20 | 56.21 | 60.34 | 65.35 |
| Camarilla | 49.57 | 50.40 | 51.24 | 52.08 | 52.92 | 53.76 | 54.59 |
| Woodie | 38.37 | 42.28 | 47.51 | 51.42 | 56.65 | 60.56 | 65.79 |
| Fibonacci | 42.06 | 45.55 | 47.71 | 51.20 | 54.69 | 56.85 | 60.34 |
Numerical data
The following is the status of the technical indicators and moving averages at the time of publication of this technical analysis:
| RSI (14): | 59.39 | |
| MACD (12,26,9): | 1.1800 | |
| Directional Movement: | 16.51 | |
| AROON (14): | 14.29 | |
| DEMA (21): | 52.84 | |
| Parabolic SAR (0,02-0,02-0,2): | 49.41 | |
| Elder Ray (13): | 1.14 | |
| Super Trend (3,10): | 54.80 | |
| Zig ZAG (10): | 53.05 | |
| VORTEX (21): | 1.1000 | |
| Stochastique (14,3,5): | 68.84 | |
| TEMA (21): | 53.36 | |
| Williams %R (14): | -33.73 | |
| Chande Momentum Oscillator (20): | -0.93 | |
| Repulse (5,40,3): | -0.8000 | |
| ROCnROLL: | 1 | |
| TRIX (15,9): | 0.3100 | |
| Courbe Coppock: | 8.99 |
| MA7: | 52.63 | |
| MA20: | 51.23 | |
| MA50: | 49.32 | |
| MA100: | 47.75 | |
| MAexp7: | 52.61 | |
| MAexp20: | 51.35 | |
| MAexp50: | 49.64 | |
| MAexp100: | 47.48 | |
| Price / MA7: | +0.80% | |
| Price / MA20: | +3.55% | |
| Price / MA50: | +7.56% | |
| Price / MA100: | +11.10% | |
| Price / MAexp7: | +0.84% | |
| Price / MAexp20: | +3.31% | |
| Price / MAexp50: | +6.87% | |
| Price / MAexp100: | +11.73% |
News
The latest news and videos published on CORNING INC. at the time of the analysis were as follows:
- Corning Reports Strong Fourth-Quarter and Full-Year 2024 Financial Results,(1) Marking Successful First Year of ‘Springboard’ Plan
- Samsung Galaxy S25 Ultra Introduces Corning® Gorilla® Armor 2, the Industry’s First Anti-Reflective Glass Ceramic for Mobile Devices
- Corning and Lumen Reach Supply Agreement on Next-Generation Fiber-Optic Cable to Support Data Center AI Demands
- Pure Lithium Appoints Former Corning Executive as Chief Operating Officer
- Discovery Life Sciences to Acquire Gentest Business from Corning Incorporated
About author

Online


Add a comment
Comments
0 comments on the analysis CORNING INC. - Daily