| Open: | 9.30 |
| Change: | +0.04 |
| Volume: | 0 |
| Low: | 9.20 |
| High: | 9.50 |
| High / Low range: | 0.30 |
| Type: | Stocks |
| Ticker: | ENB |
| ISIN: | CA29250N1050 |
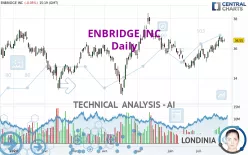
ENBRIDGE INC - Daily - Technical analysis published on 07/25/2024 (GMT)
- 133
- 0
- 07/25/2024 - 15:35
Click here for a new analysis!
- Timeframe : Daily
- - Analysis generated on 07/25/2024 - 15:35
- Status : TARGET REACHED

Summary of the analysis

Additional analysis
Quotes
The ENBRIDGE INC price is 36.55 USD. On the day, this instrument lost -0.06% and was traded between 36.43 USD and 36.65 USD over the period. The price is currently at +0.33% from its lowest and -0.27% from its highest.The Central Gaps scanner detects a bearish opening marking the presence of sellers ahead of buyers at the opening but not sufficiently marked to allow the price to register a quotation gap.
Bearish opening
Type : Bearish
Timeframe : Openning
So that you have an overall view of the price change, here is a table showing the variations over several periods:
Near a new HIGH record (1 year)
Type : Bullish
Timeframe : Weekly
Near a new HIGH record (1st january)
Type : Bullish
Timeframe : Weekly
Near a new LOW record (1 month)
Type : Bearish
Timeframe : Weekly
Technical
A technical analysis in Daily of this ENBRIDGE INC chart shows a strongly bullish trend. 85.71% of the signals given by moving averages are bullish. The overall trend is supported by the strong bullish signals from short-term moving averages. The Central Indicators market scanner is currently detecting a bullish signal that could impact this trend:
Moving Average bullish crossovers : MA20 & MA50
Type : Bullish
Timeframe : Daily
The probability of a further increase is high given the direction of the technical indicators.
But beware of excesses. The Central Indicators scanner currently detects this:
CCI indicator is overbought : over 100
Type : Neutral
Timeframe : Daily
Williams %R indicator is overbought : over -20
Type : Neutral
Timeframe : Daily
The Central Patterns scanner, which studies chart patterns, resistances and supports, has identified this signal:
Near support of channel
Type : Bullish
Timeframe : Daily
Central Candlesticks, the scanner specialised in Japanese candlesticks, detects this inversion signal that could impact the current short-term trend:
Doji
Type : Neutral
Timeframe : Daily
| S3 | S2 | S1 | Price | R1 | R2 | R3 | |
|---|---|---|---|---|---|---|---|
| ProTrendLines | 34.70 | 35.62 | 36.16 | 36.55 | 37.21 | 37.89 | 40.56 |
| Change (%) | -5.06% | -2.54% | -1.07% | - | +1.81% | +3.67% | +10.97% |
| Change | -1.85 | -0.93 | -0.39 | - | +0.66 | +1.34 | +4.01 |
| Level | Major | Major | Minor | - | Minor | Major | Intermediate |
Pivot points can also be used to set your price objectives. Here is the price situation in relation to pivot points:
| Pivot points | S3 | S2 | S1 | PP | R1 | R2 | R3 |
|---|---|---|---|---|---|---|---|
| Standard | 35.94 | 36.16 | 36.36 | 36.58 | 36.78 | 37.00 | 37.20 |
| Camarilla | 36.46 | 36.49 | 36.53 | 36.57 | 36.61 | 36.65 | 36.69 |
| Woodie | 35.94 | 36.16 | 36.36 | 36.58 | 36.78 | 37.00 | 37.20 |
| Fibonacci | 36.16 | 36.32 | 36.42 | 36.58 | 36.74 | 36.84 | 37.00 |
| Pivot points | S3 | S2 | S1 | PP | R1 | R2 | R3 |
|---|---|---|---|---|---|---|---|
| Standard | 34.91 | 35.29 | 35.92 | 36.30 | 36.93 | 37.31 | 37.94 |
| Camarilla | 36.26 | 36.36 | 36.45 | 36.54 | 36.63 | 36.73 | 36.82 |
| Woodie | 35.03 | 35.35 | 36.04 | 36.36 | 37.05 | 37.37 | 38.06 |
| Fibonacci | 35.29 | 35.68 | 35.92 | 36.30 | 36.69 | 36.93 | 37.31 |
| Pivot points | S3 | S2 | S1 | PP | R1 | R2 | R3 |
|---|---|---|---|---|---|---|---|
| Standard | 32.59 | 33.60 | 34.59 | 35.60 | 36.59 | 37.60 | 38.59 |
| Camarilla | 35.04 | 35.22 | 35.41 | 35.59 | 35.77 | 35.96 | 36.14 |
| Woodie | 32.59 | 33.60 | 34.59 | 35.60 | 36.59 | 37.60 | 38.59 |
| Fibonacci | 33.60 | 34.36 | 34.83 | 35.60 | 36.36 | 36.83 | 37.60 |
Numerical data
The following is the status of technical indicators and moving averages registered at the time this technical analysis was created:
| RSI (14): | 59.26 | |
| MACD (12,26,9): | 0.2500 | |
| Directional Movement: | 11.53 | |
| AROON (14): | 64.28 | |
| DEMA (21): | 36.34 | |
| Parabolic SAR (0,02-0,02-0,2): | 35.93 | |
| Elder Ray (13): | 0.32 | |
| Super Trend (3,10): | 35.37 | |
| Zig ZAG (10): | 36.48 | |
| VORTEX (21): | 1.1600 | |
| Stochastique (14,3,5): | 80.89 | |
| TEMA (21): | 36.60 | |
| Williams %R (14): | -20.46 | |
| Chande Momentum Oscillator (20): | 1.10 | |
| Repulse (5,40,3): | -0.1000 | |
| ROCnROLL: | 1 | |
| TRIX (15,9): | 0.0600 | |
| Courbe Coppock: | 5.03 |
| MA7: | 36.47 | |
| MA20: | 35.95 | |
| MA50: | 35.91 | |
| MA100: | 35.77 | |
| MAexp7: | 36.42 | |
| MAexp20: | 36.07 | |
| MAexp50: | 35.88 | |
| MAexp100: | 35.72 | |
| Price / MA7: | +0.22% | |
| Price / MA20: | +1.67% | |
| Price / MA50: | +1.78% | |
| Price / MA100: | +2.18% | |
| Price / MAexp7: | +0.36% | |
| Price / MAexp20: | +1.33% | |
| Price / MAexp50: | +1.87% | |
| Price / MAexp100: | +2.32% |
News
The last news published on ENBRIDGE INC at the time of the generation of this analysis was as follows:
- 07/18/2024 - 13:15 Enbridge, First Nations and Métis Partners To Advance 200-Megawatt Wind Energy Project in Saskatchewan
- 07/16/2024 - 11:15 A New Star in the Energy Constellation
- 07/10/2024 - 14:30 I-STEAM Pathways: Melding Mainstream Science, Indigenous Perspectives
- 07/08/2024 - 13:00 Prairie Pupils Young and Old Discover 'A Family Can Learn Together'
- 07/02/2024 - 15:45 African-American Theatre, Artistry and Music That 'Stirs Your Soul'
About author
Online


Add a comment
Comments
0 comments on the analysis ENBRIDGE INC - Daily