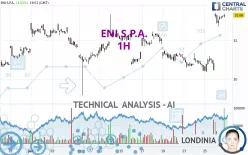
ENI S.P.A. - 1H - Technical analysis published on 07/26/2024 (GMT)
- 174
- 0
Click here for a new analysis!
- Timeframe : 1H
- - Analysis generated on
- Status : LEVEL MAINTAINED

Summary of the analysis

Additional analysis
Quotes
The ENI S.P.A. price is 31.65 USD. On the day, this instrument gained +4.49% and was traded between 31.36 USD and 31.71 USD over the period. The price is currently at +0.92% from its lowest and -0.19% from its highest.A bullish gap was detected at the opening by the Central Gaps scanner. There are a lot of buyers and they have the upper hand in the very short term.
Opening Gap UP
Type : Bullish
Timeframe : Openning
So that you have an overall view of the price change, here is a table showing the variations over several periods:
Near a new HIGH record (5 years)
Type : Bullish
Timeframe : Weekly
Near a new HIGH record (1 year)
Type : Bullish
Timeframe : Weekly
Near a new HIGH record (1st january)
Type : Bullish
Timeframe : Weekly
New HIGH record (1 month)
Type : Bullish
Timeframe : Weekly
Technical
A technical analysis in 1H of this ENI S.P.A. chart shows a strongly bullish trend. 89.29% of the signals given by moving averages are bullish. The overall trend is supported by the strong bullish signals from short-term moving averages. The Central Indicators market scanner currently does not detect any result that concerns moving averages.
In fact, 15 technical indicators on 18 studied are currently bullish. Caution: the Central Indicators scanner currently detects an excess:
RSI indicator is overbought : over 70
Type : Neutral
Timeframe : 1 hour
CCI indicator is overbought : over 100
Type : Neutral
Timeframe : 1 hour
Williams %R indicator is overbought : over -20
Type : Neutral
Timeframe : 1 hour
Pivot points : price is over resistance 2
Type : Neutral
Timeframe : Weekly
Pivot points : price is over resistance 3
Type : Neutral
Timeframe : 1 hour
The Central Patterns scanner, which studies chart patterns, resistances and supports, has identified this signal:
Resistance of channel is broken
Type : Bullish
Timeframe : 1 hour
The Central Candlesticks scanner, specialised in Japanese candlesticks, did not identify any signals.
| S3 | S2 | S1 | Price | R1 | R2 | R3 | |
|---|---|---|---|---|---|---|---|
| ProTrendLines | 30.16 | 30.58 | 31.26 | 31.65 | 31.68 | 32.22 | 33.12 |
| Change (%) | -4.71% | -3.38% | -1.23% | - | +0.09% | +1.80% | +4.64% |
| Change | -1.49 | -1.07 | -0.39 | - | +0.03 | +0.57 | +1.47 |
| Level | Intermediate | Intermediate | Major | - | Minor | Minor | Major |
Pivot points can also be used to set your price objectives. Here is the price situation in relation to pivot points:
| Pivot points | S3 | S2 | S1 | PP | R1 | R2 | R3 |
|---|---|---|---|---|---|---|---|
| Standard | 29.72 | 29.96 | 30.12 | 30.36 | 30.52 | 30.76 | 30.92 |
| Camarilla | 30.18 | 30.22 | 30.25 | 30.29 | 30.33 | 30.36 | 30.40 |
| Woodie | 29.69 | 29.94 | 30.09 | 30.34 | 30.49 | 30.74 | 30.89 |
| Fibonacci | 29.96 | 30.11 | 30.20 | 30.36 | 30.51 | 30.60 | 30.76 |
| Pivot points | S3 | S2 | S1 | PP | R1 | R2 | R3 |
|---|---|---|---|---|---|---|---|
| Standard | 29.35 | 29.85 | 30.22 | 30.72 | 31.09 | 31.59 | 31.96 |
| Camarilla | 30.34 | 30.42 | 30.50 | 30.58 | 30.66 | 30.74 | 30.82 |
| Woodie | 29.28 | 29.82 | 30.15 | 30.69 | 31.02 | 31.56 | 31.89 |
| Fibonacci | 29.85 | 30.19 | 30.39 | 30.72 | 31.06 | 31.26 | 31.59 |
| Pivot points | S3 | S2 | S1 | PP | R1 | R2 | R3 |
|---|---|---|---|---|---|---|---|
| Standard | 26.23 | 27.52 | 29.16 | 30.45 | 32.09 | 33.38 | 35.02 |
| Camarilla | 29.98 | 30.25 | 30.52 | 30.79 | 31.06 | 31.33 | 31.60 |
| Woodie | 26.40 | 27.61 | 29.33 | 30.54 | 32.26 | 33.47 | 35.19 |
| Fibonacci | 27.52 | 28.64 | 29.33 | 30.45 | 31.57 | 32.26 | 33.38 |
Numerical data
The following is the status of the technical indicators and moving averages at the time of publication of this technical analysis:
| RSI (14): | 71.20 | |
| MACD (12,26,9): | 0.2900 | |
| Directional Movement: | 22.17 | |
| AROON (14): | 42.85 | |
| DEMA (21): | 31.33 | |
| Parabolic SAR (0,02-0,02-0,2): | 30.50 | |
| Elder Ray (13): | 0.44 | |
| Super Trend (3,10): | 31.03 | |
| Zig ZAG (10): | 31.65 | |
| VORTEX (21): | 0.9300 | |
| Stochastique (14,3,5): | 94.72 | |
| TEMA (21): | 31.62 | |
| Williams %R (14): | -2.64 | |
| Chande Momentum Oscillator (20): | 1.28 | |
| Repulse (5,40,3): | 0.2600 | |
| ROCnROLL: | 1 | |
| TRIX (15,9): | 0.0700 | |
| Courbe Coppock: | 7.15 |
| MA7: | 30.67 | |
| MA20: | 30.86 | |
| MA50: | 30.77 | |
| MA100: | 31.23 | |
| MAexp7: | 31.44 | |
| MAexp20: | 31.01 | |
| MAexp50: | 30.81 | |
| MAexp100: | 30.76 | |
| Price / MA7: | +3.20% | |
| Price / MA20: | +2.56% | |
| Price / MA50: | +2.86% | |
| Price / MA100: | +1.34% | |
| Price / MAexp7: | +0.67% | |
| Price / MAexp20: | +2.06% | |
| Price / MAexp50: | +2.73% | |
| Price / MAexp100: | +2.89% |
News
The latest news and videos published on ENI S.P.A. at the time of the analysis were as follows:
- Weatherford Signs Four-Year Contract with Eni S.p.A
- Weatherford Signs Four-Year Contract with Eni S.p.A
About author
Online


Add a comment
Comments
0 comments on the analysis ENI S.P.A. - 1H