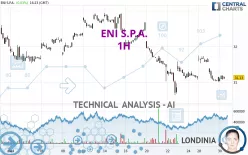
ENI S.P.A. - 1H - Technical analysis published on 05/30/2024 (GMT)
- 135
- 0
Click here for a new analysis!
- Timeframe : 1H
- - Analysis generated on
- Status : TARGET REACHED

Summary of the analysis

Additional analysis
Quotes
The ENI S.P.A. price is 31.11 USD. The price registered a decrease of -0.03% on the session with the lowest point at 31.02 USD and the highest point at 31.20 USD. The deviation from the price is +0.29% for the low point and -0.29% for the high point.A study of price movements over other periods shows the following variations:
Near a new HIGH record (5 years)
Type : Bullish
Timeframe : Weekly
Near a new HIGH record (1 month)
Type : Bullish
Timeframe : Weekly
Technical
A technical analysis in 1H of this ENI S.P.A. chart shows a sharp bearish trend. 92.86% of the signals given by moving averages are bearish. This strongly bearish trend is supported by the strong bearish signals given by short-term moving averages. The Central Indicators market scanner currently does not detect any result that concerns moving averages.
In fact, according to the parameters integrated into the Central Analyzer system, 12 technical indicators out of 18 analysed are currently bearish. Caution: the Central Indicators scanner currently detects an excess:
MACD indicator: bullish divergence
Type : Bullish
Timeframe : 1 hour
Williams %R indicator is oversold : under -80
Type : Neutral
Timeframe : 1 hour
Price is back under the pivot point
Type : Bearish
Timeframe : Weekly
The Central Patterns scanner, which studies chart patterns, resistances and supports, has identified these signals:
Near horizontal support
Type : Bullish
Timeframe : 1 hour
Near support of channel
Type : Bullish
Timeframe : 1 hour
For a small rebound in the very short term, the Central Candlesticks scanner currently notes the presence of these bullish patterns in Japanese candlesticks:
Bullish harami
Type : Bullish
Timeframe : 1 hour
Bullish harami cross
Type : Bullish
Timeframe : 1 hour
| S3 | S2 | S1 | Price | R1 | R2 | R3 | |
|---|---|---|---|---|---|---|---|
| ProTrendLines | 29.33 | 30.17 | 30.62 | 31.11 | 31.12 | 31.83 | 32.22 |
| Change (%) | -5.72% | -3.02% | -1.58% | - | +0.03% | +2.31% | +3.57% |
| Change | -1.78 | -0.94 | -0.49 | - | +0.01 | +0.72 | +1.11 |
| Level | Major | Minor | Minor | - | Major | Intermediate | Major |
Attention could also be paid to pivot points to set price objectives:
| Pivot points | S3 | S2 | S1 | PP | R1 | R2 | R3 |
|---|---|---|---|---|---|---|---|
| Standard | 30.57 | 30.79 | 30.95 | 31.17 | 31.33 | 31.55 | 31.71 |
| Camarilla | 31.02 | 31.05 | 31.09 | 31.12 | 31.16 | 31.19 | 31.23 |
| Woodie | 30.55 | 30.78 | 30.93 | 31.16 | 31.31 | 31.54 | 31.69 |
| Fibonacci | 30.79 | 30.93 | 31.02 | 31.17 | 31.31 | 31.40 | 31.55 |
| Pivot points | S3 | S2 | S1 | PP | R1 | R2 | R3 |
|---|---|---|---|---|---|---|---|
| Standard | 28.93 | 29.78 | 30.46 | 31.31 | 31.99 | 32.84 | 33.52 |
| Camarilla | 30.73 | 30.87 | 31.01 | 31.15 | 31.29 | 31.43 | 31.57 |
| Woodie | 28.86 | 29.74 | 30.39 | 31.27 | 31.92 | 32.80 | 33.45 |
| Fibonacci | 29.78 | 30.36 | 30.72 | 31.31 | 31.89 | 32.25 | 32.84 |
| Pivot points | S3 | S2 | S1 | PP | R1 | R2 | R3 |
|---|---|---|---|---|---|---|---|
| Standard | 28.61 | 29.89 | 30.71 | 31.99 | 32.81 | 34.09 | 34.91 |
| Camarilla | 30.96 | 31.16 | 31.35 | 31.54 | 31.73 | 31.93 | 32.12 |
| Woodie | 28.39 | 29.78 | 30.49 | 31.88 | 32.59 | 33.98 | 34.69 |
| Fibonacci | 29.89 | 30.69 | 31.18 | 31.99 | 32.79 | 33.28 | 34.09 |
Numerical data
The following is the status of technical indicators and moving averages registered at the time this technical analysis was created:
| RSI (14): | 44.68 | |
| MACD (12,26,9): | -0.0800 | |
| Directional Movement: | -2.75 | |
| AROON (14): | -71.43 | |
| DEMA (21): | 31.13 | |
| Parabolic SAR (0,02-0,02-0,2): | 31.37 | |
| Elder Ray (13): | -0.07 | |
| Super Trend (3,10): | 31.44 | |
| Zig ZAG (10): | 31.14 | |
| VORTEX (21): | 0.8600 | |
| Stochastique (14,3,5): | 18.77 | |
| TEMA (21): | 31.11 | |
| Williams %R (14): | -79.30 | |
| Chande Momentum Oscillator (20): | -0.48 | |
| Repulse (5,40,3): | 0.2300 | |
| ROCnROLL: | 2 | |
| TRIX (15,9): | -0.0200 | |
| Courbe Coppock: | 2.60 |
| MA7: | 31.23 | |
| MA20: | 31.58 | |
| MA50: | 31.80 | |
| MA100: | 31.20 | |
| MAexp7: | 31.13 | |
| MAexp20: | 31.22 | |
| MAexp50: | 31.36 | |
| MAexp100: | 31.52 | |
| Price / MA7: | -0.38% | |
| Price / MA20: | -1.49% | |
| Price / MA50: | -2.17% | |
| Price / MA100: | -0.29% | |
| Price / MAexp7: | -0.06% | |
| Price / MAexp20: | -0.35% | |
| Price / MAexp50: | -0.80% | |
| Price / MAexp100: | -1.30% |
News
The last news published on ENI S.P.A. at the time of the generation of this analysis was as follows:
- Weatherford Signs Four-Year Contract with Eni S.p.A
- Weatherford Signs Four-Year Contract with Eni S.p.A
About author
Online


Add a comment
Comments
0 comments on the analysis ENI S.P.A. - 1H