| Open: | - |
| Change: | - |
| Volume: | - |
| Low: | - |
| High: | - |
| High / Low range: | - |
| Type: | Stocks |
| Ticker: | DY |
| ISIN: |
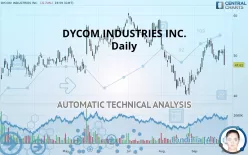
DYCOM INDUSTRIES INC. - Daily - Technical analysis published on 10/02/2019 (GMT)
- 270
- 0
- 10/02/2019 - 11:26
- Who voted?
Click here for a new analysis!
- Timeframe : Daily
- - Analysis generated on 10/02/2019 - 11:25
- Status : TARGET REACHED

Summary of the analysis

Additional analysis
Quotes
The DYCOM INDUSTRIES INC. rating is 47.61 USD. On the day, this instrument lost -6.74% with the lowest point at 47.57 USD and the highest point at 52.41 USD. The deviation from the price is +0.08% for the low point and -9.16% for the high point.The Central Gaps scanner detects the formation of a bullish gap marking the strong presence of buyers against sellers at the opening. This formed a quotation gap.
Opening Gap UP
Type : Bullish
Timeframe : Openning
So that you have an overall view of the price change, here is a table showing the variations over several periods:
Near a new HIGH record (1 month)
Type : Bullish
Timeframe : Weekly
Technical
A technical analysis in Daily of this DYCOM INDUSTRIES INC. chart shows a sharp bearish trend. 82.14% of the signals given by moving averages are bearish. This strongly bearish trend is showing signs of slowing down given the slightly bearish signals given by short-term moving averages. The Central Indicators market scanner is currently detecting a bullish signal that could impact this trend:
Moving Average bullish crossovers : AMA20 & AMA50
Type : Bullish
Timeframe : Daily
Technical indicators are slightly bearish. There is therefore considerable uncertainty about the continuation of the decline.
Central Indicators, the detector scanner for these technical indicators has recently detected several signals:
Pivot points : price is under support 1
Type : Neutral
Timeframe : Weekly
Pivot points : price is under support 3
Type : Neutral
Timeframe : Daily
Ichimoku : price is over the cloud
Type : Bullish
Timeframe : Daily
Price is back over the pivot point
Type : Bullish
Timeframe : Daily
Price is back over the pivot point
Type : Bullish
Timeframe : Weekly
Williams %R indicator is back under -50
Type : Bearish
Timeframe : Daily
An analysis of the price chart with the Central Patterns scanner (detector of chart patterns and resistances and supports) shows a result that can have an impact on the price change:
Near horizontal support
Type : Bullish
Timeframe : Daily
Central Candlesticks, the scanner specialised in Japanese candlesticks, detects a bullish signal that could support the hypothesis of a small rebound in the very short term:
Bullish engulfing lines
Type : Bullish
Timeframe : Daily
| S3 | S2 | S1 | Price | R1 | R2 | R3 | |
|---|---|---|---|---|---|---|---|
| ProTrendLines | 40.47 | 43.33 | 45.55 | 47.61 | 49.97 | 53.75 | 59.99 |
| Change (%) | -15.00% | -8.99% | -4.33% | - | +4.96% | +12.90% | +26.00% |
| Change | -7.14 | -4.28 | -2.06 | - | +2.36 | +6.14 | +12.38 |
| Level | Intermediate | Major | Major | - | Intermediate | Intermediate | Intermediate |
Pivot points can also be used to set your price objectives. Here is the price situation in relation to pivot points:
| Pivot points | S3 | S2 | S1 | PP | R1 | R2 | R3 |
|---|---|---|---|---|---|---|---|
| Standard | 49.05 | 49.61 | 50.33 | 50.90 | 51.62 | 52.18 | 52.90 |
| Camarilla | 50.70 | 50.81 | 50.93 | 51.05 | 51.17 | 51.29 | 51.40 |
| Woodie | 49.12 | 49.65 | 50.41 | 50.93 | 51.69 | 52.22 | 52.98 |
| Fibonacci | 49.61 | 50.10 | 50.40 | 50.90 | 51.39 | 51.69 | 52.18 |
| Pivot points | S3 | S2 | S1 | PP | R1 | R2 | R3 |
|---|---|---|---|---|---|---|---|
| Standard | 45.46 | 46.85 | 48.76 | 50.15 | 52.06 | 53.45 | 55.36 |
| Camarilla | 49.76 | 50.07 | 50.37 | 50.67 | 50.97 | 51.28 | 51.58 |
| Woodie | 45.72 | 46.98 | 49.02 | 50.28 | 52.32 | 53.58 | 55.62 |
| Fibonacci | 46.85 | 48.11 | 48.89 | 50.15 | 51.41 | 52.19 | 53.45 |
| Pivot points | S3 | S2 | S1 | PP | R1 | R2 | R3 |
|---|---|---|---|---|---|---|---|
| Standard | 32.76 | 37.78 | 44.42 | 49.44 | 56.08 | 61.10 | 67.74 |
| Camarilla | 47.84 | 48.91 | 49.98 | 51.05 | 52.12 | 53.19 | 54.26 |
| Woodie | 33.56 | 38.19 | 45.22 | 49.85 | 56.88 | 61.51 | 68.54 |
| Fibonacci | 37.78 | 42.24 | 44.99 | 49.44 | 53.90 | 56.65 | 61.10 |
Numerical data
The following is the status of technical indicators and moving averages registered at the time this technical analysis was created:
| RSI (14): | 44.49 | |
| MACD (12,26,9): | 0.6300 | |
| Directional Movement: | -2.07 | |
| AROON (14): | -64.29 | |
| DEMA (21): | 50.29 | |
| Parabolic SAR (0,02-0,02-0,2): | 52.58 | |
| Elder Ray (13): | 0.12 | |
| Super Trend (3,10): | 46.92 | |
| Zig ZAG (10): | 47.61 | |
| VORTEX (21): | 1.0400 | |
| Stochastique (14,3,5): | 32.77 | |
| TEMA (21): | 51.18 | |
| Williams %R (14): | -99.42 | |
| Chande Momentum Oscillator (20): | -4.92 | |
| Repulse (5,40,3): | -11.2400 | |
| ROCnROLL: | 2 | |
| TRIX (15,9): | 0.2800 | |
| Courbe Coppock: | 6.83 |
| MA7: | 49.98 | |
| MA20: | 49.83 | |
| MA50: | 48.76 | |
| MA100: | 51.31 | |
| MAexp7: | 49.90 | |
| MAexp20: | 49.48 | |
| MAexp50: | 49.46 | |
| MAexp100: | 50.73 | |
| Price / MA7: | -4.74% | |
| Price / MA20: | -4.46% | |
| Price / MA50: | -2.36% | |
| Price / MA100: | -7.21% | |
| Price / MAexp7: | -4.59% | |
| Price / MAexp20: | -3.78% | |
| Price / MAexp50: | -3.74% | |
| Price / MAexp100: | -6.15% |
News
The latest news and videos published on DYCOM INDUSTRIES INC. at the time of the analysis were as follows:
- 09/11/2019 - 20:40 Dycom Industries, Inc. To Participate in D.A. Davidson's 18th Annual Diversified Industrials & Services Conference
- 08/28/2019 - 10:00 Dycom Industries, Inc. Announces Fiscal 2020 Second Quarter Results And Provides Guidance For The Next Fiscal Quarter
- 08/21/2019 - 20:32 Dycom Industries, Inc. To Report Fiscal 2020 Second Quarter Results And Host Conference Call
- 06/05/2019 - 20:31 Dycom Industries, Inc. To Present At The Stifel 2019 Cross Sector Insight Conference
- 05/21/2019 - 10:00 Dycom Industries, Inc. Announces Fiscal 2020 First Quarter Results And Provides Guidance For The Next Fiscal Quarter
About author

Online


Add a comment
Comments
0 comments on the analysis DYCOM INDUSTRIES INC. - Daily