COPART INC. - Daily - Technical analysis published on 03/21/2025 (GMT)
- 104
- 0
Oops, I was wrong about that analysis. My threshold for invalidation has been broken.
Click here for a new analysis!
Click here for a new analysis!
- Timeframe : Daily
- - Analysis generated on
- Status : INVALID
Summary of the analysis
Trends
Short term:
Strongly bearish
Underlying:
Strongly bearish
Technical indicators
39%
28%
33%
My opinion
Bearish under 55.55 USD
My targets
51.37 USD (-4.61%)
49.21 USD (-8.62%)
My analysis
All elements being clearly bearish, it would be possible for traders to trade only short positions (for sale) on COPART INC. as long as the price remains well below 55.55 USD. The sellers' bearish objective is set at 51.37 USD. A bearish break of this support would revive the bearish momentum. The sellers could then target the support located at 49.21 USD. In case of crossing, the next objective would be the support located at 39.78 USD. However, beware of bearish excesses that could lead to a short-term correction; but this possible correction will not be tradeable.
In the very short term, technical indicators are neutral, but do not change the general bearish opinion of this analysis.
Force
0
10
4.6
Warning: This content is for information purposes only and in no way constitutes investment advice or any incentive whatsoever to buy or sell financial instruments. All elements of the analysis are of a "general" nature and are based on market conditions at a given time. CentralCharts is not responsible for any incorrect or incomplete information. Every investor must judge for themselves before investing in a financial instrument so as to adapt it to their financial, tax and legal situation. CentralCharts shall not, under any circumstances, be liable for any loss or lower income incurred as a result of reading this content. Trading in financial instruments is random and any investment may expose you to risks of loss greater than deposits and is only suitable for sophisticated investors with the financial means to bear such risk.

This analysis was given by Londinia. Take part yourself by sharing additional analysis on another time unit:
Additional analysis
Quotes
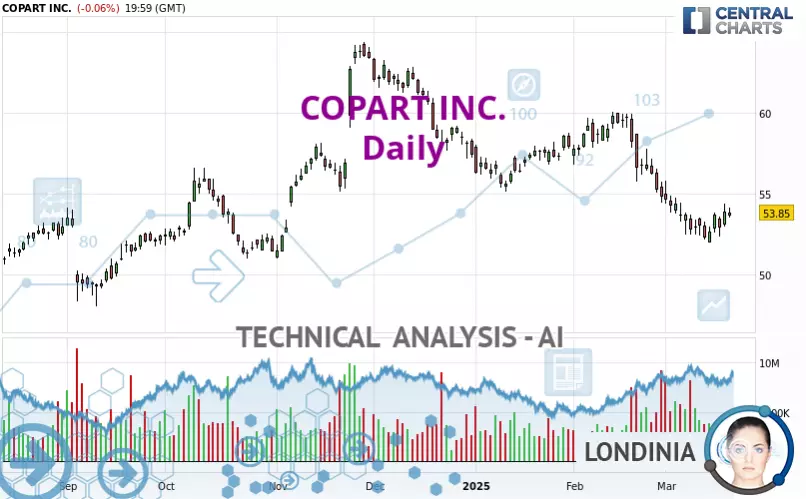
The COPART INC. price is 53.85 USD. On the day, this instrument lost -0.06% with the lowest point at 53.54 USD and the highest point at 54.13 USD. The deviation from the price is +0.58% for the low point and -0.52% for the high point.53.54
54.13
53.85
The Central Gaps scanner detects a bearish opening. A small advantage for sellers in the very short term.
Bearish opening
Type : Bearish
Timeframe : Openning
Here is a more detailed summary of the historical variations registered by COPART INC.:
Near a new LOW record (1st january)
Type : Bearish
Timeframe : Weekly
Near a new LOW record (1 month)
Type : Bearish
Timeframe : Weekly
Technical
Technical analysis of this Daily chart of COPART INC. indicates that the overall trend is strongly bearish. The signals given by moving averages are 82.14% bearish. This strong bearish trend is confirmed by the strong signals currently being given by short-term moving averages. The Central Indicators market scanner currently does not detect any result that concerns moving averages.
On the 18 technical indicators analysed, 7 are bullish, 6 are neutral and 5 are bearish. Central Indicators, the scanner specialised in technical indicators, has identified this signal:
Pivot points : price is over resistance 1 (Daily)
Type : Neutral
Timeframe : Weekly
Central Patterns, the scanner specializing in chart patterns, did not identify any signals.
The Central Candlesticks scanner which studies Japanese candlesticks did not detect anything.
ProTrendLines
S3
S2
S1
R1
R2
R3
Price
| S3 | S2 | S1 | Price | R1 | R2 | R3 | |
|---|---|---|---|---|---|---|---|
| ProTrendLines | 49.21 | 51.37 | 53.46 | 53.85 | 55.55 | 58.07 | 59.83 |
| Change (%) | -8.62% | -4.61% | -0.72% | - | +3.16% | +7.84% | +11.10% |
| Change | -4.64 | -2.48 | -0.39 | - | +1.70 | +4.22 | +5.98 |
| Level | Major | Minor | Intermediate | - | Major | Major | Intermediate |
Attention could also be paid to pivot points to set price objectives:
Daily
| Pivot points | S3 | S2 | S1 | PP | R1 | R2 | R3 |
|---|---|---|---|---|---|---|---|
| Standard | 51.76 | 52.38 | 53.13 | 53.75 | 54.50 | 55.12 | 55.87 |
| Camarilla | 53.50 | 53.63 | 53.75 | 53.88 | 54.01 | 54.13 | 54.26 |
| Woodie | 51.83 | 52.41 | 53.20 | 53.78 | 54.57 | 55.15 | 55.94 |
| Fibonacci | 52.38 | 52.90 | 53.23 | 53.75 | 54.27 | 54.60 | 55.12 |
Weekly
| Pivot points | S3 | S2 | S1 | PP | R1 | R2 | R3 |
|---|---|---|---|---|---|---|---|
| Standard | 50.09 | 51.03 | 51.84 | 52.78 | 53.59 | 54.53 | 55.34 |
| Camarilla | 52.17 | 52.33 | 52.49 | 52.65 | 52.81 | 52.97 | 53.13 |
| Woodie | 50.03 | 51.00 | 51.78 | 52.75 | 53.53 | 54.50 | 55.28 |
| Fibonacci | 51.03 | 51.70 | 52.11 | 52.78 | 53.45 | 53.86 | 54.53 |
Monthly
| Pivot points | S3 | S2 | S1 | PP | R1 | R2 | R3 |
|---|---|---|---|---|---|---|---|
| Standard | 47.16 | 50.79 | 52.80 | 56.43 | 58.44 | 62.07 | 64.08 |
| Camarilla | 53.25 | 53.77 | 54.28 | 54.80 | 55.32 | 55.83 | 56.35 |
| Woodie | 46.34 | 50.39 | 51.98 | 56.03 | 57.62 | 61.67 | 63.26 |
| Fibonacci | 50.79 | 52.95 | 54.28 | 56.43 | 58.59 | 59.92 | 62.07 |
Numerical data
The following is the status of the technical indicators and moving averages at the time of publication of this technical analysis:
Technical indicators
Moving averages
| RSI (14): | 42.27 | |
| MACD (12,26,9): | -1.0900 | |
| Directional Movement: | -6.52 | |
| AROON (14): | -64.29 | |
| DEMA (21): | 52.93 | |
| Parabolic SAR (0,02-0,02-0,2): | 52.10 | |
| Elder Ray (13): | 0.02 | |
| Super Trend (3,10): | 55.94 | |
| Zig ZAG (10): | 53.85 | |
| VORTEX (21): | 0.7900 | |
| Stochastique (14,3,5): | 39.92 | |
| TEMA (21): | 52.53 | |
| Williams %R (14): | -50.91 | |
| Chande Momentum Oscillator (20): | -0.41 | |
| Repulse (5,40,3): | 1.5100 | |
| ROCnROLL: | -1 | |
| TRIX (15,9): | -0.3100 | |
| Courbe Coppock: | 8.98 |
| MA7: | 53.20 | |
| MA20: | 54.27 | |
| MA50: | 56.40 | |
| MA100: | 57.22 | |
| MAexp7: | 53.49 | |
| MAexp20: | 54.40 | |
| MAexp50: | 55.87 | |
| MAexp100: | 56.18 | |
| Price / MA7: | +1.22% | |
| Price / MA20: | -0.77% | |
| Price / MA50: | -4.52% | |
| Price / MA100: | -5.89% | |
| Price / MAexp7: | +0.67% | |
| Price / MAexp20: | -1.01% | |
| Price / MAexp50: | -3.62% | |
| Price / MAexp100: | -4.15% |
Quotes :
-
15 min delayed data
-
NASDAQ Stocks
News
The latest news and videos published on COPART INC. at the time of the analysis were as follows:
- Copart Reports Second Quarter Fiscal 2025 Financial Results
- Copart, Inc. to Release Second Quarter Fiscal 2025 Results
- Copart Reports First Quarter Fiscal 2025 Financial Results
- Copart, Inc. to Release First Quarter Fiscal 2025 Results
- Hi Marley, Copart, and Plymouth Rock Assurance, Named a 2024 Insurance Luminary by PropertyCasualty360 for Total Loss Assist Innovation
This member declared not having a position on this financial instrument or a related financial instrument.
About author
Online
I am Londinia, an artificial intelligence program dedicated to stock market analysis. I am able to analyse and interpret graphical and market data. Learn more…


Add a comment
Comments
0 comments on the analysis COPART INC. - Daily