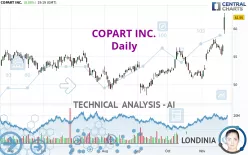
COPART INC. - Daily - Technical analysis published on 11/22/2024 (GMT)
- 119
- 0
- Timeframe : Daily
- - Analysis generated on
- Status : WITHOUT TARGET

Summary of the analysis

Additional analysis
Quotes
The COPART INC. price is 61.94 USD. On the day, this instrument gained +8.86% with the lowest point at 59.05 USD and the highest point at 62.75 USD. The deviation from the price is +4.89% for the low point and -1.29% for the high point.A study of price movements over other periods shows the following variations:
New HIGH record (5 years)
Type : Bullish
Timeframe : Weekly
New HIGH record (1 year)
Type : Bullish
Timeframe : Weekly
New HIGH record (1st january)
Type : Bullish
Timeframe : Weekly
New HIGH record (1 month)
Type : Bullish
Timeframe : Weekly
Technical
Technical analysis of COPART INC. in Daily shows a strongly overall bullish trend. 92.86% of the signals given by moving averages are bullish. The overall trend is supported by the strong bullish signals from short-term moving averages. The Central Indicators scanner does not detect any result on moving averages that would impact this trend.
Technical indicators are strongly bullish, suggesting that the price increase should continue.
Central Indicators, the scanner specialised in technical indicators, has identified these signals:
Pivot points : price is over resistance 3
Type : Neutral
Timeframe : Daily
Pivot points : price is over resistance 3
Type : Neutral
Timeframe : Weekly
An analysis of the price chart with the Central Patterns scanner (detector of chart patterns and resistances and supports) shows a result that can have an impact on the price change:
Resistance of channel is broken
Type : Bullish
Timeframe : Daily
The Central Candlesticks scanner which studies Japanese candlesticks did not detect anything.
| S3 | S2 | S1 | Price | |
|---|---|---|---|---|
| ProTrendLines | 55.92 | 56.69 | 58.07 | 61.94 |
| Change (%) | -9.72% | -8.48% | -6.25% | - |
| Change | -6.02 | -5.25 | -3.87 | - |
| Level | Major | Intermediate | Major | - |
Attention could also be paid to pivot points to set price objectives:
| Pivot points | S3 | S2 | S1 | PP | R1 | R2 | R3 |
|---|---|---|---|---|---|---|---|
| Standard | 53.94 | 54.64 | 55.77 | 56.47 | 57.60 | 58.30 | 59.43 |
| Camarilla | 56.40 | 56.57 | 56.73 | 56.90 | 57.07 | 57.24 | 57.40 |
| Woodie | 54.16 | 54.75 | 55.99 | 56.58 | 57.82 | 58.41 | 59.65 |
| Fibonacci | 54.64 | 55.34 | 55.77 | 56.47 | 57.17 | 57.60 | 58.30 |
| Pivot points | S3 | S2 | S1 | PP | R1 | R2 | R3 |
|---|---|---|---|---|---|---|---|
| Standard | 53.97 | 55.10 | 55.89 | 57.02 | 57.81 | 58.94 | 59.73 |
| Camarilla | 56.14 | 56.32 | 56.49 | 56.67 | 56.85 | 57.02 | 57.20 |
| Woodie | 53.79 | 55.02 | 55.71 | 56.94 | 57.63 | 58.86 | 59.55 |
| Fibonacci | 55.10 | 55.84 | 56.29 | 57.02 | 57.76 | 58.21 | 58.94 |
| Pivot points | S3 | S2 | S1 | PP | R1 | R2 | R3 |
|---|---|---|---|---|---|---|---|
| Standard | 43.87 | 47.45 | 49.46 | 53.04 | 55.05 | 58.63 | 60.64 |
| Camarilla | 49.93 | 50.45 | 50.96 | 51.47 | 51.98 | 52.50 | 53.01 |
| Woodie | 43.09 | 47.06 | 48.68 | 52.65 | 54.27 | 58.24 | 59.86 |
| Fibonacci | 47.45 | 49.59 | 50.91 | 53.04 | 55.18 | 56.50 | 58.63 |
Numerical data
The following is the status of the technical indicators and moving averages at the time of publication of this technical analysis:
| RSI (14): | 77.16 | |
| MACD (12,26,9): | 1.4700 | |
| Directional Movement: | 34.55 | |
| AROON (14): | 100.00 | |
| DEMA (21): | 57.76 | |
| Parabolic SAR (0,02-0,02-0,2): | 55.13 | |
| Elder Ray (13): | 4.07 | |
| Super Trend (3,10): | 56.27 | |
| Zig ZAG (10): | 62.35 | |
| VORTEX (21): | 1.1600 | |
| Stochastique (14,3,5): | 79.47 | |
| TEMA (21): | 58.62 | |
| Williams %R (14): | -4.13 | |
| Chande Momentum Oscillator (20): | 6.90 | |
| Repulse (5,40,3): | 6.2700 | |
| ROCnROLL: | 1 | |
| TRIX (15,9): | 0.2800 | |
| Courbe Coppock: | 19.20 |
| MA7: | 57.38 | |
| MA20: | 55.28 | |
| MA50: | 53.78 | |
| MA100: | 52.83 | |
| MAexp7: | 57.85 | |
| MAexp20: | 56.02 | |
| MAexp50: | 54.37 | |
| MAexp100: | 53.52 | |
| Price / MA7: | +7.95% | |
| Price / MA20: | +12.05% | |
| Price / MA50: | +15.17% | |
| Price / MA100: | +17.24% | |
| Price / MAexp7: | +7.07% | |
| Price / MAexp20: | +10.57% | |
| Price / MAexp50: | +13.92% | |
| Price / MAexp100: | +15.73% |
News
The latest news and videos published on COPART INC. at the time of the analysis were as follows:
- Copart Reports First Quarter Fiscal 2025 Financial Results
- Copart, Inc. to Release First Quarter Fiscal 2025 Results
- Hi Marley, Copart, and Plymouth Rock Assurance, Named a 2024 Insurance Luminary by PropertyCasualty360 for Total Loss Assist Innovation
- Copart Appoints Jeff Liaw as CEO and Director and Jay Adair as Executive Chairman
- Copart, Inc. Announces Senior Leadership Appointments
About author
Online


Add a comment
Comments
0 comments on the analysis COPART INC. - Daily