COPART INC. - 1H - Technical analysis published on 01/25/2024 (GMT)
- 146
- 0
Click here for a new analysis!
- Timeframe : 1H
- - Analysis generated on
- Status : INVALID

Summary of the analysis

Additional analysis
Quotes
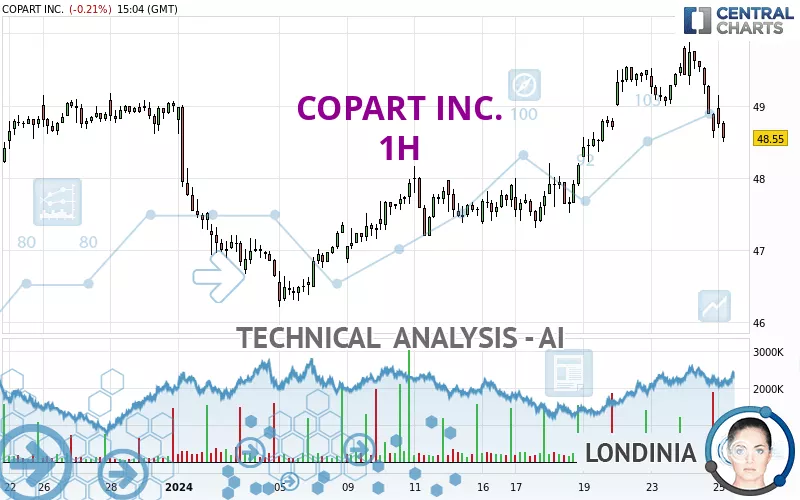
The COPART INC. rating is 48.61 USD. The price registered a decrease of -0.08% on the session with the lowest point at 48.59 USD and the highest point at 49.14 USD. The deviation from the price is +0.04% for the low point and -1.08% for the high point.A study of price movements over other periods shows the following variations:
Near a new HIGH record (5 years)
Type : Bullish
Timeframe : Weekly
Near a new HIGH record (1 year)
Type : Bullish
Timeframe : Weekly
New HIGH record (1st january)
Type : Bullish
Timeframe : Weekly
New HIGH record (1 month)
Type : Bullish
Timeframe : Weekly
Technical
Technical analysis of COPART INC. in 1H shows an overall bullish trend. The signals given by moving averages are 67.86% bullish. This bullish trend could slow down given the slightly bearish signals currently being given by short-term moving averages. An assessment of moving averages reveals several bearish and bullish signals:
Bearish trend reversal : Moving Average 20
Type : Bearish
Timeframe : 1 hour
Bullish price crossover with adaptative moving average 50
Type : Bullish
Timeframe : 1 hour
An assessment of technical indicators shows a slightly bearish signal.
Caution: the Central Indicators scanner currently detects an excess:
CCI indicator is oversold : under -100
Type : Neutral
Timeframe : 1 hour
Previous candle closed under Bollinger bands
Type : Neutral
Timeframe : 1 hour
An analysis of the price chart with the Central Patterns scanner (detector of chart patterns and resistances and supports) shows a result that can have an impact on the price change:
Near support of channel
Type : Bullish
Timeframe : 1 hour
The Central Candlesticks scanner which studies Japanese candlesticks did not detect anything.
| S3 | S2 | S1 | Price | R1 | R2 | R3 | |
|---|---|---|---|---|---|---|---|
| ProTrendLines | 46.87 | 47.37 | 48.17 | 48.61 | 49.00 | 49.55 | 49.88 |
| Change (%) | -3.58% | -2.55% | -0.91% | - | +0.80% | +1.93% | +2.61% |
| Change | -1.74 | -1.24 | -0.44 | - | +0.39 | +0.94 | +1.27 |
| Level | Intermediate | Minor | Intermediate | - | Intermediate | Intermediate | Minor |
Pivot points can also be used to set your price objectives. Here is the price situation in relation to pivot points:
| Pivot points | S3 | S2 | S1 | PP | R1 | R2 | R3 |
|---|---|---|---|---|---|---|---|
| Standard | 46.84 | 47.70 | 48.17 | 49.03 | 49.50 | 50.36 | 50.83 |
| Camarilla | 48.28 | 48.41 | 48.53 | 48.65 | 48.77 | 48.89 | 49.02 |
| Woodie | 46.66 | 47.60 | 47.99 | 48.93 | 49.32 | 50.26 | 50.65 |
| Fibonacci | 47.70 | 48.21 | 48.52 | 49.03 | 49.54 | 49.85 | 50.36 |
| Pivot points | S3 | S2 | S1 | PP | R1 | R2 | R3 |
|---|---|---|---|---|---|---|---|
| Standard | 46.18 | 46.75 | 47.72 | 48.29 | 49.26 | 49.83 | 50.80 |
| Camarilla | 48.28 | 48.42 | 48.56 | 48.70 | 48.84 | 48.98 | 49.12 |
| Woodie | 46.39 | 46.85 | 47.93 | 48.39 | 49.47 | 49.93 | 51.01 |
| Fibonacci | 46.75 | 47.34 | 47.70 | 48.29 | 48.88 | 49.24 | 49.83 |
| Pivot points | S3 | S2 | S1 | PP | R1 | R2 | R3 |
|---|---|---|---|---|---|---|---|
| Standard | 44.04 | 45.56 | 47.28 | 48.80 | 50.52 | 52.04 | 53.76 |
| Camarilla | 48.11 | 48.41 | 48.70 | 49.00 | 49.30 | 49.59 | 49.89 |
| Woodie | 44.14 | 45.61 | 47.38 | 48.85 | 50.62 | 52.09 | 53.86 |
| Fibonacci | 45.56 | 46.80 | 47.56 | 48.80 | 50.04 | 50.80 | 52.04 |
Numerical data
The following is the status of technical indicators and moving averages registered at the time this technical analysis was created:
| RSI (14): | 47.65 | |
| MACD (12,26,9): | 0.1200 | |
| Directional Movement: | -3.59 | |
| AROON (14): | -35.72 | |
| DEMA (21): | 49.35 | |
| Parabolic SAR (0,02-0,02-0,2): | 49.75 | |
| Elder Ray (13): | -0.21 | |
| Super Trend (3,10): | 49.62 | |
| Zig ZAG (10): | 48.84 | |
| VORTEX (21): | 0.9400 | |
| Stochastique (14,3,5): | 8.27 | |
| TEMA (21): | 49.16 | |
| Williams %R (14): | -79.70 | |
| Chande Momentum Oscillator (20): | -0.30 | |
| Repulse (5,40,3): | -1.5700 | |
| ROCnROLL: | -1 | |
| TRIX (15,9): | 0.0800 | |
| Courbe Coppock: | 0.72 |
| MA7: | 48.72 | |
| MA20: | 48.07 | |
| MA50: | 48.84 | |
| MA100: | 46.73 | |
| MAexp7: | 48.97 | |
| MAexp20: | 49.11 | |
| MAexp50: | 48.70 | |
| MAexp100: | 48.36 | |
| Price / MA7: | -0.23% | |
| Price / MA20: | +1.12% | |
| Price / MA50: | -0.47% | |
| Price / MA100: | +4.02% | |
| Price / MAexp7: | -0.74% | |
| Price / MAexp20: | -1.02% | |
| Price / MAexp50: | -0.18% | |
| Price / MAexp100: | +0.52% |
News
Don't forget to follow the news on COPART INC.. At the time of publication of this analysis, the latest news was as follows:
- Copart, Inc. Announces Senior Leadership Appointments
- Copart Announces Investment in Heavy Equipment Auction Company Purple Wave
- Hi Marley and Copart Announce Strategic Partnership to Support Auto Insurers
- Copart, Inc. Announces a Two-for-One Stock Split
- Copart, Inc. to Present at Baird’s Global Consumer, Technology & Services Conference
About author
Online


Add a comment
Comments
0 comments on the analysis COPART INC. - 1H