COPART INC. - Daily - Technical analysis published on 12/11/2023 (GMT)
- 238
- 0
Click here for a new analysis!
- Timeframe : Daily
- - Analysis generated on
- Status : INVALID
Summary of the analysis

Additional analysis
Quotes
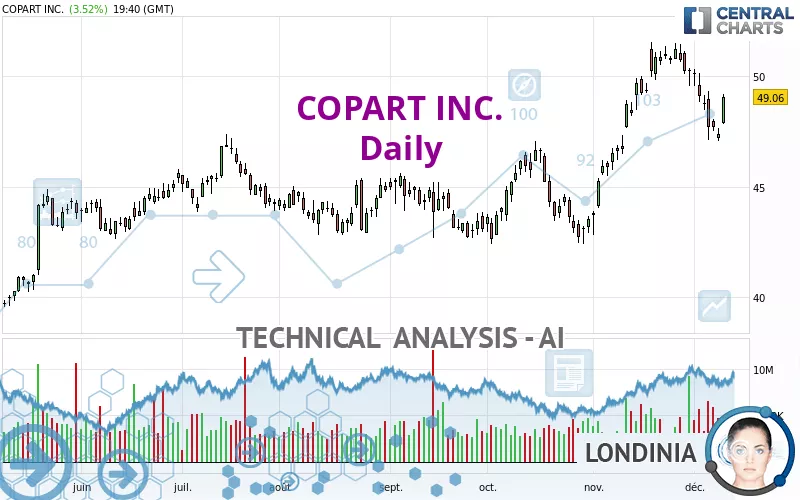
COPART INC. rating 49.06 USD. The price has increased by +3.52% since the last closing with the lowest point at 47.84 USD and the highest point at 49.19 USD. The deviation from the price is +2.55% for the low point and -0.26% for the high point.A bullish gap was detected at the opening by the Central Gaps scanner. There are a lot of buyers and they have the upper hand in the very short term.
Opening Gap UP
Type : Bullish
Timeframe : Openning
A study of price movements over other periods shows the following variations:
Near a new HIGH record (5 years)
Type : Bullish
Timeframe : Weekly
Near a new HIGH record (1 year)
Type : Bullish
Timeframe : Weekly
Near a new HIGH record (1st january)
Type : Bullish
Timeframe : Weekly
Near a new HIGH record (1 month)
Type : Bullish
Timeframe : Weekly
Technical
A technical analysis in Daily of this COPART INC. chart shows a strongly bullish trend. 85.71% of the signals given by moving averages are bullish. The slightly bullish signals given by the short-term moving averages show a weakening of the global trend. The Central Indicators market scanner currently does not detect any result that concerns moving averages.
In fact, of the 18 technical indicators analysed by Central Analyzer, 7 are bullish, 6 are neutral and 5 are bearish. Central Indicators, the scanner specialised in technical indicators, has identified these signals:
Pivot points : price is over resistance 3
Type : Neutral
Timeframe : Daily
RSI indicator is back over 50
Type : Bullish
Timeframe : Daily
Price is back over the pivot point
Type : Bullish
Timeframe : Weekly
The Central Patterns scanner, which studies chart patterns, resistances and supports, has identified this signal:
Near horizontal support
Type : Bullish
Timeframe : Daily
The presence of these bullish Japanese candlestick patterns detected by Central Candlesticks that could cause a very short term rebound were also noted:
White morning star
Type : Bullish
Timeframe : Daily
Upside gap
Type : Bullish
Timeframe : Daily
| S3 | S2 | S1 | Price | R1 | |
|---|---|---|---|---|---|
| ProTrendLines | 42.66 | 44.57 | 46.87 | 49.06 | 51.20 |
| Change (%) | -13.05% | -9.15% | -4.46% | - | +4.36% |
| Change | -6.40 | -4.49 | -2.19 | - | +2.14 |
| Level | Major | Minor | Major | - | Major |
Pivot points can also be used to set your price objectives. Here is the price situation in relation to pivot points:
| Pivot points | S3 | S2 | S1 | PP | R1 | R2 | R3 |
|---|---|---|---|---|---|---|---|
| Standard | 46.55 | 46.82 | 47.10 | 47.37 | 47.65 | 47.92 | 48.20 |
| Camarilla | 47.24 | 47.29 | 47.34 | 47.39 | 47.44 | 47.49 | 47.54 |
| Woodie | 46.57 | 46.82 | 47.12 | 47.37 | 47.67 | 47.92 | 48.22 |
| Fibonacci | 46.82 | 47.03 | 47.16 | 47.37 | 47.58 | 47.71 | 47.92 |
| Pivot points | S3 | S2 | S1 | PP | R1 | R2 | R3 |
|---|---|---|---|---|---|---|---|
| Standard | 43.25 | 45.16 | 46.28 | 48.19 | 49.31 | 51.22 | 52.34 |
| Camarilla | 46.56 | 46.84 | 47.11 | 47.39 | 47.67 | 47.95 | 48.22 |
| Woodie | 42.85 | 44.96 | 45.88 | 47.99 | 48.91 | 51.02 | 51.94 |
| Fibonacci | 45.16 | 46.32 | 47.04 | 48.19 | 49.35 | 50.07 | 51.22 |
| Pivot points | S3 | S2 | S1 | PP | R1 | R2 | R3 |
|---|---|---|---|---|---|---|---|
| Standard | 36.16 | 39.49 | 44.86 | 48.19 | 53.56 | 56.89 | 62.26 |
| Camarilla | 47.83 | 48.63 | 49.42 | 50.22 | 51.02 | 51.82 | 52.61 |
| Woodie | 37.17 | 40.00 | 45.87 | 48.70 | 54.57 | 57.40 | 63.27 |
| Fibonacci | 39.49 | 42.82 | 44.87 | 48.19 | 51.52 | 53.57 | 56.89 |
Numerical data
The following is the status of the technical indicators and moving averages at the time of publication of this technical analysis:
| RSI (14): | 55.00 | |
| MACD (12,26,9): | 0.4200 | |
| Directional Movement: | 3.83 | |
| AROON (14): | -50.00 | |
| DEMA (21): | 49.55 | |
| Parabolic SAR (0,02-0,02-0,2): | 49.92 | |
| Elder Ray (13): | -0.38 | |
| Super Trend (3,10): | 50.24 | |
| Zig ZAG (10): | 49.11 | |
| VORTEX (21): | 0.9600 | |
| Stochastique (14,3,5): | 21.99 | |
| TEMA (21): | 49.06 | |
| Williams %R (14): | -54.64 | |
| Chande Momentum Oscillator (20): | -1.84 | |
| Repulse (5,40,3): | 1.7600 | |
| ROCnROLL: | 1 | |
| TRIX (15,9): | 0.2900 | |
| Courbe Coppock: | 4.75 |
| MA7: | 48.55 | |
| MA20: | 49.61 | |
| MA50: | 46.81 | |
| MA100: | 45.49 | |
| MAexp7: | 48.62 | |
| MAexp20: | 48.74 | |
| MAexp50: | 47.38 | |
| MAexp100: | 45.74 | |
| Price / MA7: | +1.05% | |
| Price / MA20: | -1.11% | |
| Price / MA50: | +4.81% | |
| Price / MA100: | +7.85% | |
| Price / MAexp7: | +0.90% | |
| Price / MAexp20: | +0.66% | |
| Price / MAexp50: | +3.55% | |
| Price / MAexp100: | +7.26% |
News
The last news published on COPART INC. at the time of the generation of this analysis was as follows:
- Copart Announces Investment in Heavy Equipment Auction Company Purple Wave
- Hi Marley and Copart Announce Strategic Partnership to Support Auto Insurers
- Copart, Inc. Announces a Two-for-One Stock Split
- Copart, Inc. to Present at Baird’s Global Consumer, Technology & Services Conference
- Copart Reports Third Quarter Fiscal 2023 Financial Results
About author

Online


Add a comment
Comments
0 comments on the analysis COPART INC. - Daily