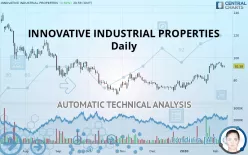
INNOVATIVE INDUSTRIAL PROPERTIES - Daily - Technical analysis published on 02/11/2020 (GMT)
- 358
- 0
- Who voted?
Click here for a new analysis!
- Timeframe : Daily
- - Analysis generated on
- Status : TARGET REACHED

Summary of the analysis

Additional analysis
Quotes
The INNOVATIVE INDUSTRIAL PROPERTIES rating is 92.58 USD. On the day, this instrument lost +0.57% and was traded between 91.09 USD and 92.99 USD over the period. The price is currently at +1.64% from its lowest and -0.44% from its highest.The Central Gaps scanner detects a bullish opening. A small advantage for buyers in the very short term.
Bullish opening
Type : Bullish
Timeframe : Openning
So that you have an overall view of the price change, here is a table showing the variations over several periods:
Near a new HIGH record (1st january)
Type : Bullish
Timeframe : Weekly
Near a new HIGH record (1 month)
Type : Bullish
Timeframe : Weekly
Technical
Technical analysis of this Daily chart of INNOVATIVE INDUSTRIAL PROPERTIES indicates that the overall trend is bullish. 78.57% of the signals given by moving averages are bullish. This bullish trend is supported by the strong bullish signals given by short-term moving averages. An assessment of moving averages reveals a bearish signal that could impact this trend:
Bearish trend reversal : Moving Average 100
Type : Bearish
Timeframe : Daily
The technical indicators are bullish. There is still some doubt about the price increase.
Caution: the Central Indicators scanner currently detects an excess:
Williams %R indicator is overbought : over -20
Type : Neutral
Timeframe : Daily
An analysis of the price chart with the Central Patterns scanner (detector of chart patterns and resistances and supports) shows a result that can have an impact on the price change:
Near resistance of triangle
Type : Bearish
Timeframe : Daily
No result was found by the Central Candlesticks scanner on Japanese candlesticks.
| S3 | S2 | S1 | Price | R1 | R2 | R3 | |
|---|---|---|---|---|---|---|---|
| ProTrendLines | 70.97 | 79.47 | 90.08 | 92.58 | 99.10 | 112.74 | 119.69 |
| Change (%) | -23.34% | -14.16% | -2.70% | - | +7.04% | +21.78% | +29.28% |
| Change | -21.61 | -13.11 | -2.50 | - | +6.52 | +20.16 | +27.11 |
| Level | Major | Intermediate | Major | - | Minor | Intermediate | Minor |
Pivot points can also be used to set your price objectives. Here is the price situation in relation to pivot points:
| Pivot points | S3 | S2 | S1 | PP | R1 | R2 | R3 |
|---|---|---|---|---|---|---|---|
| Standard | 88.25 | 89.51 | 90.78 | 92.04 | 93.31 | 94.57 | 95.84 |
| Camarilla | 91.36 | 91.60 | 91.83 | 92.06 | 92.29 | 92.52 | 92.76 |
| Woodie | 88.27 | 89.51 | 90.80 | 92.04 | 93.33 | 94.57 | 95.86 |
| Fibonacci | 89.51 | 90.47 | 91.07 | 92.04 | 93.00 | 93.60 | 94.57 |
| Pivot points | S3 | S2 | S1 | PP | R1 | R2 | R3 |
|---|---|---|---|---|---|---|---|
| Standard | 84.30 | 87.43 | 89.98 | 93.11 | 95.66 | 98.79 | 101.34 |
| Camarilla | 90.96 | 91.48 | 92.00 | 92.52 | 93.04 | 93.56 | 94.08 |
| Woodie | 84.00 | 87.29 | 89.68 | 92.97 | 95.36 | 98.65 | 101.04 |
| Fibonacci | 87.43 | 89.60 | 90.94 | 93.11 | 95.28 | 96.62 | 98.79 |
| Pivot points | S3 | S2 | S1 | PP | R1 | R2 | R3 |
|---|---|---|---|---|---|---|---|
| Standard | 52.49 | 62.20 | 75.85 | 85.55 | 99.20 | 108.91 | 122.56 |
| Camarilla | 83.08 | 85.22 | 87.36 | 89.50 | 91.64 | 93.78 | 95.92 |
| Woodie | 54.47 | 63.18 | 77.82 | 86.54 | 101.18 | 109.90 | 124.53 |
| Fibonacci | 62.20 | 71.12 | 76.63 | 85.55 | 94.47 | 99.99 | 108.91 |
Numerical data
The following is the status of the technical indicators and moving averages at the time of publication of this technical analysis:
| RSI (14): | 62.47 | |
| MACD (12,26,9): | 4.0200 | |
| Directional Movement: | 4.09 | |
| AROON (14): | 64.28 | |
| DEMA (21): | 94.01 | |
| Parabolic SAR (0,02-0,02-0,2): | 88.14 | |
| Elder Ray (13): | 1.13 | |
| Super Trend (3,10): | 85.58 | |
| Zig ZAG (10): | 92.58 | |
| VORTEX (21): | 1.1300 | |
| Stochastique (14,3,5): | 80.38 | |
| TEMA (21): | 95.76 | |
| Williams %R (14): | -18.64 | |
| Chande Momentum Oscillator (20): | 11.82 | |
| Repulse (5,40,3): | -0.8600 | |
| ROCnROLL: | 1 | |
| TRIX (15,9): | 0.7300 | |
| Courbe Coppock: | 26.98 |
| MA7: | 93.56 | |
| MA20: | 88.26 | |
| MA50: | 80.22 | |
| MA100: | 80.26 | |
| MAexp7: | 92.59 | |
| MAexp20: | 88.75 | |
| MAexp50: | 83.85 | |
| MAexp100: | 83.45 | |
| Price / MA7: | -1.05% | |
| Price / MA20: | +4.89% | |
| Price / MA50: | +15.41% | |
| Price / MA100: | +15.35% | |
| Price / MAexp7: | -0.01% | |
| Price / MAexp20: | +4.32% | |
| Price / MAexp50: | +10.41% | |
| Price / MAexp100: | +10.94% |
News
Don"t forget to follow the news on INNOVATIVE INDUSTRIAL PROPERTIES. At the time of publication of this analysis, the latest news was as follows:
- Innovative Industrial Properties to Report 2019 Fourth Quarter and Year End Results
- Innovative Industrial Properties Acquires Ohio Property and Enters Into Long-Term Lease with Green Thumb Industries (GTI)
- Innovative Industrial Properties Announces Tax Treatment of 2019 Distributions
- Innovative Industrial Properties Announces Exercise of Option to Purchase Additional Shares of Common Stock
- Innovative Industrial Properties Acquires Property in Ohio and Enters Into Long-Term Lease with Cresco Labs
About author

Online


Add a comment
Comments
0 comments on the analysis INNOVATIVE INDUSTRIAL PROPERTIES - Daily