CVR ENERGY INC. - Daily - Technical analysis published on 12/11/2019 (GMT)
- 321
- 0
- Who voted?
Click here for a new analysis!
- Timeframe : Daily
- - Analysis generated on
- Status : LEVEL MAINTAINED
Summary of the analysis

Additional analysis
Quotes
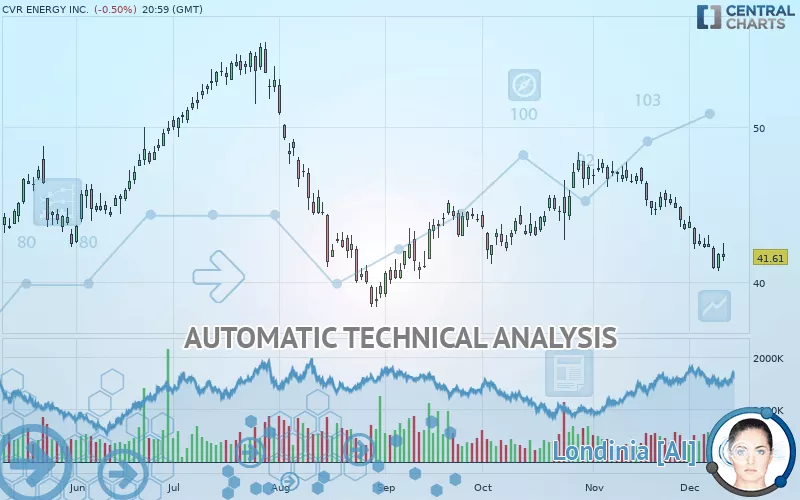
The CVR ENERGY INC. rating is 41.61 USD. The price registered a decrease of -0.50% on the session with the lowest point at 41.37 USD and the highest point at 42.54 USD. The deviation from the price is +0.58% for the low point and -2.19% for the high point.So that you have an overall view of the price change, here is a table showing the variations over several periods:
Near a new LOW record (1 month)
Type : Bearish
Timeframe : Weekly
Technical
Technical analysis of this Daily chart of CVR ENERGY INC. indicates that the overall trend is strongly bearish. The signals given by moving averages are 85.71% bearish. This strong bearish trend is confirmed by the strong signals currently being given by short-term moving averages. The Central Indicators scanner detects a bearish signal on moving averages that could impact this trend:
Moving Average bearish crossovers : MA20 & MA50
Type : Bearish
Timeframe : Daily
The probability of a further decline is moderate given the direction of the technical indicators.
Caution: the Central Indicators scanner currently detects an excess:
CCI indicator is oversold : under -100
Type : Neutral
Timeframe : Daily
CCI indicator: bullish divergence
Type : Bullish
Timeframe : Daily
Pivot points : price is under support 1
Type : Neutral
Timeframe : Weekly
Price is back over the pivot point
Type : Bullish
Timeframe : Daily
Central Patterns, the market scanner focusing on chart patterns, resistances and supports found this result:
Near support of channel
Type : Bullish
Timeframe : Daily
The Central Candlesticks scanner which studies Japanese candlesticks did not detect anything.
| S3 | S2 | S1 | Price | R1 | R2 | R3 | |
|---|---|---|---|---|---|---|---|
| ProTrendLines | 25.39 | 33.52 | 38.58 | 41.61 | 42.85 | 46.15 | 47.86 |
| Change (%) | -38.98% | -19.44% | -7.28% | - | +2.98% | +10.91% | +15.02% |
| Change | -16.22 | -8.09 | -3.03 | - | +1.24 | +4.54 | +6.25 |
| Level | Minor | Major | Major | - | Major | Major | Major |
Pivot points can also be used to set your price objectives. Here is the price situation in relation to pivot points:
| Pivot points | S3 | S2 | S1 | PP | R1 | R2 | R3 |
|---|---|---|---|---|---|---|---|
| Standard | 39.88 | 40.31 | 41.06 | 41.49 | 42.24 | 42.67 | 43.42 |
| Camarilla | 41.50 | 41.60 | 41.71 | 41.82 | 41.93 | 42.04 | 42.15 |
| Woodie | 40.05 | 40.39 | 41.23 | 41.57 | 42.41 | 42.75 | 43.59 |
| Fibonacci | 40.31 | 40.76 | 41.04 | 41.49 | 41.94 | 42.22 | 42.67 |
| Pivot points | S3 | S2 | S1 | PP | R1 | R2 | R3 |
|---|---|---|---|---|---|---|---|
| Standard | 39.54 | 40.86 | 41.66 | 42.98 | 43.79 | 45.11 | 45.91 |
| Camarilla | 41.89 | 42.08 | 42.28 | 42.47 | 42.67 | 42.86 | 43.06 |
| Woodie | 39.28 | 40.73 | 41.41 | 42.85 | 43.53 | 44.98 | 45.66 |
| Fibonacci | 40.86 | 41.67 | 42.17 | 42.98 | 43.79 | 44.30 | 45.11 |
| Pivot points | S3 | S2 | S1 | PP | R1 | R2 | R3 |
|---|---|---|---|---|---|---|---|
| Standard | 37.24 | 40.31 | 41.86 | 44.93 | 46.48 | 49.55 | 51.10 |
| Camarilla | 42.15 | 42.57 | 43.00 | 43.42 | 43.84 | 44.27 | 44.69 |
| Woodie | 36.49 | 39.93 | 41.11 | 44.55 | 45.73 | 49.17 | 50.35 |
| Fibonacci | 40.31 | 42.07 | 43.16 | 44.93 | 46.69 | 47.78 | 49.55 |
Numerical data
The following is the status of the technical indicators and moving averages at the time of publication of this technical analysis:
| RSI (14): | 34.76 | |
| MACD (12,26,9): | -0.9700 | |
| Directional Movement: | -12.54 | |
| AROON (14): | -78.57 | |
| DEMA (21): | 42.46 | |
| Parabolic SAR (0,02-0,02-0,2): | 42.98 | |
| Elder Ray (13): | -0.97 | |
| Super Trend (3,10): | 44.54 | |
| Zig ZAG (10): | 41.61 | |
| VORTEX (21): | 0.7400 | |
| Stochastique (14,3,5): | 13.07 | |
| TEMA (21): | 41.41 | |
| Williams %R (14): | -83.27 | |
| Chande Momentum Oscillator (20): | -3.68 | |
| Repulse (5,40,3): | -2.1100 | |
| ROCnROLL: | 2 | |
| TRIX (15,9): | -0.1900 | |
| Courbe Coppock: | 15.38 |
| MA7: | 42.02 | |
| MA20: | 44.05 | |
| MA50: | 44.34 | |
| MA100: | 44.10 | |
| MAexp7: | 42.17 | |
| MAexp20: | 43.51 | |
| MAexp50: | 44.10 | |
| MAexp100: | 44.05 | |
| Price / MA7: | -0.98% | |
| Price / MA20: | -5.54% | |
| Price / MA50: | -6.16% | |
| Price / MA100: | -5.65% | |
| Price / MAexp7: | -1.33% | |
| Price / MAexp20: | -4.37% | |
| Price / MAexp50: | -5.65% | |
| Price / MAexp100: | -5.54% |
News
The latest news and videos published on CVR ENERGY INC. at the time of the analysis were as follows:
- CVR Energy Announces Commencement of Exchange Offer
- CVR Energy Reports 2017 Fourth Quarter and Full Year Results And Announces Cash Dividend of 50 Cents
- CVR Energy, Inc. to Host Earnings Call
- CVR Energy Announces 2017 Fourth Quarter Earnings Call
- CVR Energy Reports 2017 Third Quarter Results And Announces Cash Dividend of 50 Cents
About author

Online


Add a comment
Comments
0 comments on the analysis CVR ENERGY INC. - Daily