DOLBY LABORATORIES - Daily - Technical analysis published on 11/12/2019 (GMT)
- 189
- 0
- Who voted?
Click here for a new analysis!
- Timeframe : Daily
- - Analysis generated on
- Status : TARGET REACHED

Summary of the analysis

Additional analysis
Quotes
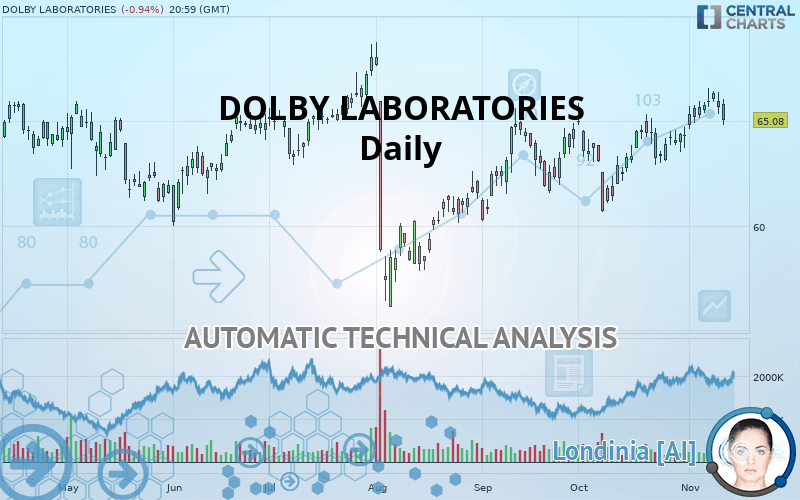
The DOLBY LABORATORIES rating is 65.08 USD. On the day, this instrument lost -0.94% and was traded between 64.83 USD and 66.07 USD over the period. The price is currently at +0.39% from its lowest and -1.50% from its highest.A bullish opening was detected by the Central Gaps scanner. Buyers are trying to impose a bullish momentum in the very short term.
Bullish opening
Type : Bullish
Timeframe : Openning
So that you have an overall view of the price change, here is a table showing the variations over several periods:
Near a new HIGH record (1st january)
Type : Bullish
Timeframe : Weekly
Technical
A technical analysis in Daily of this DOLBY LABORATORIES chart shows a strongly bullish trend. The signals given by the moving averages are 92.86% bullish. This strong bullish trend is confirmed by the strong signals currently being given by short-term moving averages. The Central Indicators scanner does not detect any result on moving averages that would impact this trend.
In fact, only 9 technical indicators out of 18 studied are currently bullish. Caution: the Central Indicators scanner currently detects an excess:
CCI indicator is overbought : over 100
Type : Neutral
Timeframe : Daily
Pivot points : price is under support 1
Type : Neutral
Timeframe : Daily
Pivot points : price is under support 1
Type : Neutral
Timeframe : Weekly
Price is back over the pivot point
Type : Bullish
Timeframe : Weekly
The analysis of the price chart with Central Patterns scanners does not return any result.
Central Candlesticks, the scanner specialised in Japanese candlesticks, detects a bearish signal that could support the hypothesis of a small drop in the very short term:
Bearish engulfing lines
Type : Bearish
Timeframe : Daily
| S3 | S2 | S1 | Price | R1 | R2 | R3 | |
|---|---|---|---|---|---|---|---|
| ProTrendLines | 57.38 | 59.87 | 63.24 | 65.08 | 65.78 | 68.10 | 71.78 |
| Change (%) | -11.83% | -8.01% | -2.83% | - | +1.08% | +4.64% | +10.30% |
| Change | -7.70 | -5.21 | -1.84 | - | +0.70 | +3.02 | +6.70 |
| Level | Minor | Major | Major | - | Major | Intermediate | Major |
Pivot points can also be used to set your price objectives. Here is the price situation in relation to pivot points:
| Pivot points | S3 | S2 | S1 | PP | R1 | R2 | R3 |
|---|---|---|---|---|---|---|---|
| Standard | 64.17 | 64.76 | 65.23 | 65.82 | 66.29 | 66.88 | 67.35 |
| Camarilla | 65.41 | 65.51 | 65.60 | 65.70 | 65.80 | 65.89 | 65.99 |
| Woodie | 64.11 | 64.73 | 65.17 | 65.79 | 66.23 | 66.85 | 67.29 |
| Fibonacci | 64.76 | 65.17 | 65.42 | 65.82 | 66.23 | 66.48 | 66.88 |
| Pivot points | S3 | S2 | S1 | PP | R1 | R2 | R3 |
|---|---|---|---|---|---|---|---|
| Standard | 63.65 | 64.29 | 65.31 | 65.95 | 66.97 | 67.61 | 68.63 |
| Camarilla | 65.88 | 66.04 | 66.19 | 66.34 | 66.49 | 66.64 | 66.80 |
| Woodie | 63.85 | 64.39 | 65.51 | 66.05 | 67.17 | 67.71 | 68.83 |
| Fibonacci | 64.29 | 64.92 | 65.31 | 65.95 | 66.58 | 66.97 | 67.61 |
| Pivot points | S3 | S2 | S1 | PP | R1 | R2 | R3 |
|---|---|---|---|---|---|---|---|
| Standard | 56.15 | 58.41 | 61.37 | 63.63 | 66.59 | 68.85 | 71.81 |
| Camarilla | 62.90 | 63.37 | 63.85 | 64.33 | 64.81 | 65.29 | 65.77 |
| Woodie | 56.50 | 58.59 | 61.72 | 63.81 | 66.94 | 69.03 | 72.16 |
| Fibonacci | 58.41 | 60.40 | 61.64 | 63.63 | 65.62 | 66.86 | 68.85 |
Numerical data
The following is the status of the technical indicators and moving averages at the time of publication of this technical analysis:
| RSI (14): | 54.54 | |
| MACD (12,26,9): | 0.6600 | |
| Directional Movement: | 5.62 | |
| AROON (14): | 78.57 | |
| DEMA (21): | 65.61 | |
| Parabolic SAR (0,02-0,02-0,2): | 63.61 | |
| Elder Ray (13): | 0.32 | |
| Super Trend (3,10): | 63.37 | |
| Zig ZAG (10): | 65.08 | |
| VORTEX (21): | 1.0900 | |
| Stochastique (14,3,5): | 75.73 | |
| TEMA (21): | 65.90 | |
| Williams %R (14): | -42.13 | |
| Chande Momentum Oscillator (20): | 1.17 | |
| Repulse (5,40,3): | -1.9200 | |
| ROCnROLL: | -1 | |
| TRIX (15,9): | 0.1300 | |
| Courbe Coppock: | 5.28 |
| MA7: | 65.66 | |
| MA20: | 64.69 | |
| MA50: | 63.77 | |
| MA100: | 63.27 | |
| MAexp7: | 65.44 | |
| MAexp20: | 64.78 | |
| MAexp50: | 63.91 | |
| MAexp100: | 63.54 | |
| Price / MA7: | -0.88% | |
| Price / MA20: | +0.60% | |
| Price / MA50: | +2.05% | |
| Price / MA100: | +2.86% | |
| Price / MAexp7: | -0.55% | |
| Price / MAexp20: | +0.46% | |
| Price / MAexp50: | +1.83% | |
| Price / MAexp100: | +2.42% |
News
The last news published on DOLBY LABORATORIES at the time of the generation of this analysis was as follows:
- Consolidated Research: 2019 Summary Expectations for Varonis, Dolby Laboratories, Alder BioPharmaceuticals, Retail Properties of America, Cerus, and Motorcar Parts of America — Fundamental Analysis, Key Performance Indications
- Dolby Laboratories Earns Frost & Sullivan's Customer Value Leadership Award for its Superior Audio and Video Conferencing Technology
- Investor Expectations to Drive Momentum within Cintas, StoneMor Partners, Curtiss-Wright, Dolby Laboratories, PBF Logistics LP, and Monmouth Real Estate Investment — Discovering Underlying Factors of Influence
- Investor Network: Dolby Laboratories, Inc. to Host Earnings Call
-
 Dolby Laboratories
About author

Online


Add a comment
Comments
0 comments on the analysis DOLBY LABORATORIES - Daily