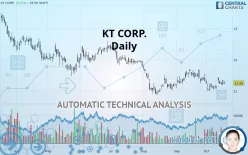
KT CORP. - Daily - Technical analysis published on 10/17/2019 (GMT)
- 155
- 0
- Who voted?
Click here for a new analysis!
- Timeframe : Daily
- - Analysis generated on
- Status : INVALID

Summary of the analysis

Additional analysis
Quotes
The KT CORP. rating is 11.25 USD. The price has increased by +0.27% since the last closing with the lowest point at 11.22 USD and the highest point at 11.31 USD. The deviation from the price is +0.27% for the low point and -0.53% for the high point.Here is a more detailed summary of the historical variations registered by KT CORP.:
Near a new LOW record (5 years)
Type : Bearish
Timeframe : Weekly
Near a new LOW record (1 year)
Type : Bearish
Timeframe : Weekly
Near a new LOW record (1st january)
Type : Bearish
Timeframe : Weekly
Technical
Technical analysis of this Daily chart of KT CORP. indicates that the overall trend is bearish. 64.29% of the signals given by moving averages are bearish. Caution: the neutral signals currently given by short-term moving averages show us that the global trend is losing momentum. The Central Indicators scanner does not detect any result on moving averages that would impact this trend.
The probability of a further increase is slight given the direction of the technical indicators.
Caution: the Central Indicators scanner currently detects an excess:
Williams %R indicator is overbought : over -20
Type : Neutral
Timeframe : Daily
Price is back over the pivot point
Type : Bullish
Timeframe : Weekly
Price is back under the pivot point
Type : Bearish
Timeframe : Daily
An analysis of the price chart with the Central Patterns scanner (detector of chart patterns and resistances and supports) shows a result that can have an impact on the price change:
Near resistance of triangle
Type : Bearish
Timeframe : Daily
The Central Candlesticks scanner, specialised in Japanese candlesticks, did not identify any signals.
| S1 | Price | R1 | R2 | R3 | |
|---|---|---|---|---|---|
| ProTrendLines | 10.98 | 11.25 | 11.65 | 12.41 | 13.39 |
| Change (%) | -2.40% | - | +3.56% | +10.31% | +19.02% |
| Change | -0.27 | - | +0.40 | +1.16 | +2.14 |
| Level | Major | - | Major | Intermediate | Minor |
To determine price objectives, it is also possible to use the pivot points. Here is the price position in relation to pivot points:
| Pivot points | S3 | S2 | S1 | PP | R1 | R2 | R3 |
|---|---|---|---|---|---|---|---|
| Standard | 11.01 | 11.09 | 11.16 | 11.24 | 11.31 | 11.39 | 11.46 |
| Camarilla | 11.18 | 11.19 | 11.21 | 11.22 | 11.23 | 11.25 | 11.26 |
| Woodie | 11.00 | 11.09 | 11.15 | 11.24 | 11.30 | 11.39 | 11.45 |
| Fibonacci | 11.09 | 11.15 | 11.19 | 11.24 | 11.30 | 11.34 | 11.39 |
| Pivot points | S3 | S2 | S1 | PP | R1 | R2 | R3 |
|---|---|---|---|---|---|---|---|
| Standard | 10.71 | 10.87 | 11.10 | 11.26 | 11.49 | 11.65 | 11.88 |
| Camarilla | 11.22 | 11.26 | 11.29 | 11.33 | 11.37 | 11.40 | 11.44 |
| Woodie | 10.75 | 10.89 | 11.14 | 11.28 | 11.53 | 11.67 | 11.92 |
| Fibonacci | 10.87 | 11.02 | 11.11 | 11.26 | 11.41 | 11.50 | 11.65 |
| Pivot points | S3 | S2 | S1 | PP | R1 | R2 | R3 |
|---|---|---|---|---|---|---|---|
| Standard | 10.45 | 10.77 | 11.04 | 11.36 | 11.63 | 11.95 | 12.22 |
| Camarilla | 11.15 | 11.20 | 11.26 | 11.31 | 11.36 | 11.42 | 11.47 |
| Woodie | 10.43 | 10.76 | 11.02 | 11.35 | 11.61 | 11.94 | 12.20 |
| Fibonacci | 10.77 | 11.00 | 11.14 | 11.36 | 11.59 | 11.73 | 11.95 |
Numerical data
The following are the details of the technical indicators and moving averages that were collected to generate this technical analysis:
| RSI (14): | 48.89 | |
| MACD (12,26,9): | -0.0400 | |
| Directional Movement: | 5.70 | |
| AROON (14): | -21.43 | |
| DEMA (21): | 11.19 | |
| Parabolic SAR (0,02-0,02-0,2): | 11.03 | |
| Elder Ray (13): | 0.04 | |
| Super Trend (3,10): | 11.59 | |
| Zig ZAG (10): | 11.25 | |
| VORTEX (21): | 0.8600 | |
| Stochastique (14,3,5): | 41.82 | |
| TEMA (21): | 11.19 | |
| Williams %R (14): | -54.55 | |
| Chande Momentum Oscillator (20): | 0.01 | |
| Repulse (5,40,3): | -1.4000 | |
| ROCnROLL: | -1 | |
| TRIX (15,9): | -0.0600 | |
| Courbe Coppock: | 2.55 |
| MA7: | 11.22 | |
| MA20: | 11.26 | |
| MA50: | 11.25 | |
| MA100: | 11.64 | |
| MAexp7: | 11.22 | |
| MAexp20: | 11.25 | |
| MAexp50: | 11.36 | |
| MAexp100: | 11.64 | |
| Price / MA7: | +0.27% | |
| Price / MA20: | -0.09% | |
| Price / MA50: | -0% | |
| Price / MA100: | -3.35% | |
| Price / MAexp7: | +0.27% | |
| Price / MAexp20: | -0% | |
| Price / MAexp50: | -0.97% | |
| Price / MAexp100: | -3.35% |
About author

Online


Add a comment
Comments
0 comments on the analysis KT CORP. - Daily