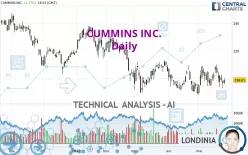
CUMMINS INC. - Daily - Technical analysis published on 05/25/2022 (GMT)
- 296
- 0
Click here for a new analysis!
- Timeframe : Daily
- - Analysis generated on
- Status : INVALID

Summary of the analysis

Additional analysis
Quotes
CUMMINS INC. rating 198.80 USD. The price has increased by +1.17% since the last closing and was traded between 195.87 USD and 200.09 USD over the period. The price is currently at +1.50% from its lowest and -0.64% from its highest.The Central Gaps scanner detects a bullish opening. A small advantage for buyers in the very short term.
Bullish opening
Type : Bullish
Timeframe : Openning
A study of price movements over other periods shows the following variations:
Near a new LOW record (1 year)
Type : Bearish
Timeframe : Weekly
Near a new LOW record (1st january)
Type : Bearish
Timeframe : Weekly
Near a new LOW record (1 month)
Type : Bearish
Timeframe : Weekly
Technical
Technical analysis of this Daily chart of CUMMINS INC. indicates that the overall trend is strongly bearish. 82.14% of the signals given by moving averages are bearish. This strongly bearish trend is showing signs of slowing down given the slightly bearish signals given by short-term moving averages. The Central Indicators scanner does not detect any result on moving averages that would impact this trend.
In fact, only 7 technical indicators out of 18 studied are currently bearish. Central Indicators, the scanner specialised in technical indicators, has identified these signals:
RSI indicator is back over 50
Type : Bullish
Timeframe : Daily
Price is back under the pivot point
Type : Bearish
Timeframe : Weekly
Central Patterns, the scanner specializing in chart patterns, did not identify any signals.
No result was found by the Central Candlesticks scanner on Japanese candlesticks.
| S3 | S2 | S1 | Price | R1 | R2 | R3 | |
|---|---|---|---|---|---|---|---|
| ProTrendLines | 169.86 | 188.12 | 194.78 | 198.80 | 207.22 | 215.21 | 225.52 |
| Change (%) | -14.56% | -5.37% | -2.02% | - | +4.24% | +8.25% | +13.44% |
| Change | -28.94 | -10.68 | -4.02 | - | +8.42 | +16.41 | +26.72 |
| Level | Intermediate | Major | Minor | - | Major | Intermediate | Minor |
To determine price objectives, it is also possible to use the pivot points. Here is the price position in relation to pivot points:
| Pivot points | S3 | S2 | S1 | PP | R1 | R2 | R3 |
|---|---|---|---|---|---|---|---|
| Standard | 187.38 | 189.98 | 193.24 | 195.84 | 199.10 | 201.70 | 204.96 |
| Camarilla | 194.90 | 195.44 | 195.97 | 196.51 | 197.05 | 197.58 | 198.12 |
| Woodie | 187.72 | 190.15 | 193.58 | 196.01 | 199.44 | 201.87 | 205.30 |
| Fibonacci | 189.98 | 192.22 | 193.60 | 195.84 | 198.08 | 199.46 | 201.70 |
| Pivot points | S3 | S2 | S1 | PP | R1 | R2 | R3 |
|---|---|---|---|---|---|---|---|
| Standard | 176.38 | 185.03 | 191.17 | 199.82 | 205.96 | 214.61 | 220.75 |
| Camarilla | 193.24 | 194.60 | 195.95 | 197.31 | 198.67 | 200.02 | 201.38 |
| Woodie | 175.13 | 184.40 | 189.92 | 199.19 | 204.71 | 213.98 | 219.50 |
| Fibonacci | 185.03 | 190.68 | 194.17 | 199.82 | 205.47 | 208.96 | 214.61 |
| Pivot points | S3 | S2 | S1 | PP | R1 | R2 | R3 |
|---|---|---|---|---|---|---|---|
| Standard | 159.53 | 173.30 | 180.58 | 194.35 | 201.63 | 215.40 | 222.68 |
| Camarilla | 182.06 | 183.99 | 185.92 | 187.85 | 189.78 | 191.71 | 193.64 |
| Woodie | 156.28 | 171.68 | 177.33 | 192.73 | 198.38 | 213.78 | 219.43 |
| Fibonacci | 173.30 | 181.34 | 186.31 | 194.35 | 202.39 | 207.36 | 215.40 |
Numerical data
The following are the details of the technical indicators and moving averages that were collected to generate this technical analysis:
| RSI (14): | 49.15 | |
| MACD (12,26,9): | 0.0600 | |
| Directional Movement: | -6.71 | |
| AROON (14): | -28.57 | |
| DEMA (21): | 199.16 | |
| Parabolic SAR (0,02-0,02-0,2): | 207.27 | |
| Elder Ray (13): | -1.23 | |
| Super Trend (3,10): | 208.05 | |
| Zig ZAG (10): | 198.40 | |
| VORTEX (21): | 1.0200 | |
| Stochastique (14,3,5): | 33.00 | |
| TEMA (21): | 199.99 | |
| Williams %R (14): | -63.16 | |
| Chande Momentum Oscillator (20): | -2.84 | |
| Repulse (5,40,3): | -0.2400 | |
| ROCnROLL: | 2 | |
| TRIX (15,9): | 0.0200 | |
| Courbe Coppock: | 1.38 |
| MA7: | 200.36 | |
| MA20: | 198.94 | |
| MA50: | 199.80 | |
| MA100: | 207.79 | |
| MAexp7: | 199.04 | |
| MAexp20: | 199.10 | |
| MAexp50: | 200.68 | |
| MAexp100: | 205.84 | |
| Price / MA7: | -0.78% | |
| Price / MA20: | -0.07% | |
| Price / MA50: | -0.50% | |
| Price / MA100: | -4.33% | |
| Price / MAexp7: | -0.12% | |
| Price / MAexp20: | -0.15% | |
| Price / MAexp50: | -0.94% | |
| Price / MAexp100: | -3.42% |
News
The latest news and videos published on CUMMINS INC. at the time of the analysis were as follows:
- Daimler Truck North America and Cummins Collaborate to Drive Hydrogen Fuel Cell Trucks Forward in North America
- Cummins Inc. Declares Quarterly Common Stock Dividend
- Cummins Reports First Quarter 2022 Results
- Cummins’ Filtration Business Submits Confidential Registration Statement for Proposed Initial Public Offering1
- Cummins Completes Acquisition of Jacobs Vehicle Systems
About author

Online


Add a comment
Comments
0 comments on the analysis CUMMINS INC. - Daily