| Open: | 147.54 |
| Change: | +6.09 |
| Volume: | 466,543 |
| Low: | 145.08 |
| High: | 153.30 |
| High / Low range: | 8.22 |
| Type: | Stocks |
| Ticker: | CLR |
| ISIN: | ES0105121000 |
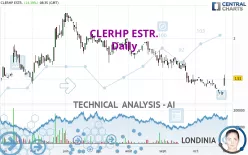
CLERHP ESTR. - Daily - Technical analysis published on 10/31/2022 (GMT)
- 168
- 0
- 10/31/2022 - 09:35
Click here for a new analysis!
- Timeframe : Daily
- - Analysis generated on 10/31/2022 - 09:35
- Status : INVALID

Summary of the analysis

Additional analysis
Quotes
The CLERHP ESTR. rating is 1.510 EUR. The price has increased by +14.39% since the last closing and was between 1.420 EUR and 1.550 EUR. This implies that the price is at +6.34% from its lowest and at -2.58% from its highest.A bullish gap was detected at the opening by the Central Gaps scanner. There are a lot of buyers and they have the upper hand in the very short term.
Opening Gap UP
Type : Bullish
Timeframe : Openning
A study of price movements over other periods shows the following variations:
Near a new LOW record (1st january)
Type : Bearish
Timeframe : Weekly
New LOW record (1 month)
Type : Bearish
Timeframe : Weekly
Technical
A technical analysis in Daily of this CLERHP ESTR. chart shows a bearish trend. The signals given by moving averages are 71.43% bearish. This bearish trend could slow down given the neutral signals currently being given by short-term moving averages. An assessment of moving averages reveals several bullish signals that could impact this trend:
Bullish price crossover with Moving Average 20
Type : Bullish
Timeframe : Daily
Bullish price crossover with adaptative moving average 20
Type : Bullish
Timeframe : Daily
Bullish price crossover with adaptative moving average 50
Type : Bullish
Timeframe : Daily
In fact, according to the parameters integrated into the Central Analyzer system, 11 technical indicators out of 18 analysed are currently bullish. But beware of excesses. The Central Indicators scanner currently detects this:
MACD indicator: bullish divergence
Type : Bullish
Timeframe : Daily
Williams %R indicator is overbought : over -20
Type : Neutral
Timeframe : Daily
Pivot points : price is over resistance 3
Type : Neutral
Timeframe : Daily
Pivot points : price is over resistance 3
Type : Neutral
Timeframe : Weekly
RSI indicator is back over 50
Type : Bullish
Timeframe : Daily
MACD crosses UP its Moving Average
Type : Bullish
Timeframe : Daily
Parabolic SAR indicator bullish reversal
Type : Bullish
Timeframe : Daily
Aroon indicator bullish trend
Type : Bullish
Timeframe : Daily
SuperTrend indicator bullish reversal
Type : Bullish
Timeframe : Daily
Momentum indicator is back over 0
Type : Bullish
Timeframe : Daily
The Central Patterns scanner, which studies chart patterns, resistances and supports, has identified these signals:
Near horizontal resistance
Type : Bearish
Timeframe : Daily
Resistance of channel is broken
Type : Bullish
Timeframe : Daily
The Central Candlesticks scanner which studies Japanese candlesticks did not detect anything.
| S3 | S2 | S1 | Price | R1 | R2 | R3 | |
|---|---|---|---|---|---|---|---|
| ProTrendLines | 1.168 | 1.300 | 1.493 | 1.510 | 1.685 | 1.833 | 1.930 |
| Change (%) | -22.65% | -13.91% | -1.13% | - | +11.59% | +21.39% | +27.81% |
| Change | -0.342 | -0.210 | -0.017 | - | +0.175 | +0.323 | +0.420 |
| Level | Major | Minor | Intermediate | - | Minor | Intermediate | Major |
To determine price objectives, it is also possible to use the pivot points. Here is the price position in relation to pivot points:
| Pivot points | S3 | S2 | S1 | PP | R1 | R2 | R3 |
|---|---|---|---|---|---|---|---|
| Standard | 1.260 | 1.280 | 1.300 | 1.320 | 1.340 | 1.360 | 1.380 |
| Camarilla | 1.309 | 1.313 | 1.316 | 1.320 | 1.324 | 1.327 | 1.331 |
| Woodie | 1.260 | 1.280 | 1.300 | 1.320 | 1.340 | 1.360 | 1.380 |
| Fibonacci | 1.280 | 1.295 | 1.305 | 1.320 | 1.335 | 1.345 | 1.360 |
| Pivot points | S3 | S2 | S1 | PP | R1 | R2 | R3 |
|---|---|---|---|---|---|---|---|
| Standard | 1.193 | 1.247 | 1.283 | 1.337 | 1.373 | 1.427 | 1.463 |
| Camarilla | 1.295 | 1.304 | 1.312 | 1.320 | 1.328 | 1.337 | 1.345 |
| Woodie | 1.185 | 1.243 | 1.275 | 1.333 | 1.365 | 1.423 | 1.455 |
| Fibonacci | 1.247 | 1.281 | 1.302 | 1.337 | 1.371 | 1.392 | 1.427 |
| Pivot points | S3 | S2 | S1 | PP | R1 | R2 | R3 |
|---|---|---|---|---|---|---|---|
| Standard | 0.977 | 1.203 | 1.337 | 1.563 | 1.697 | 1.923 | 2.057 |
| Camarilla | 1.371 | 1.404 | 1.437 | 1.470 | 1.503 | 1.536 | 1.569 |
| Woodie | 0.930 | 1.180 | 1.290 | 1.540 | 1.650 | 1.900 | 2.010 |
| Fibonacci | 1.203 | 1.341 | 1.426 | 1.563 | 1.701 | 1.786 | 1.923 |
Numerical data
The following is the status of the technical indicators and moving averages at the time of publication of this technical analysis:
| RSI (14): | 54.57 | |
| MACD (12,26,9): | -0.0550 | |
| Directional Movement: | 10.989 | |
| AROON (14): | 14.286 | |
| DEMA (21): | 1.362 | |
| Parabolic SAR (0,02-0,02-0,2): | 1.300 | |
| Elder Ray (13): | 0.071 | |
| Super Trend (3,10): | 1.287 | |
| Zig ZAG (10): | 1.510 | |
| VORTEX (21): | 0.7500 | |
| Stochastique (14,3,5): | 38.53 | |
| TEMA (21): | 1.370 | |
| Williams %R (14): | -16.00 | |
| Chande Momentum Oscillator (20): | 0.070 | |
| Repulse (5,40,3): | 6.7120 | |
| ROCnROLL: | -1 | |
| TRIX (15,9): | -0.6010 | |
| Courbe Coppock: | 11.46 |
| MA7: | 1.377 | |
| MA20: | 1.436 | |
| MA50: | 1.581 | |
| MA100: | 1.752 | |
| MAexp7: | 1.401 | |
| MAexp20: | 1.441 | |
| MAexp50: | 1.558 | |
| MAexp100: | 1.652 | |
| Price / MA7: | +9.66% | |
| Price / MA20: | +5.15% | |
| Price / MA50: | -4.49% | |
| Price / MA100: | -13.81% | |
| Price / MAexp7: | +7.78% | |
| Price / MAexp20: | +4.79% | |
| Price / MAexp50: | -3.08% | |
| Price / MAexp100: | -8.60% |
News
Don't forget to follow the news on CLERHP ESTR.. At the time of publication of this analysis, the latest news was as follows:
About author
Online


Add a comment
Comments
0 comments on the analysis CLERHP ESTR. - Daily