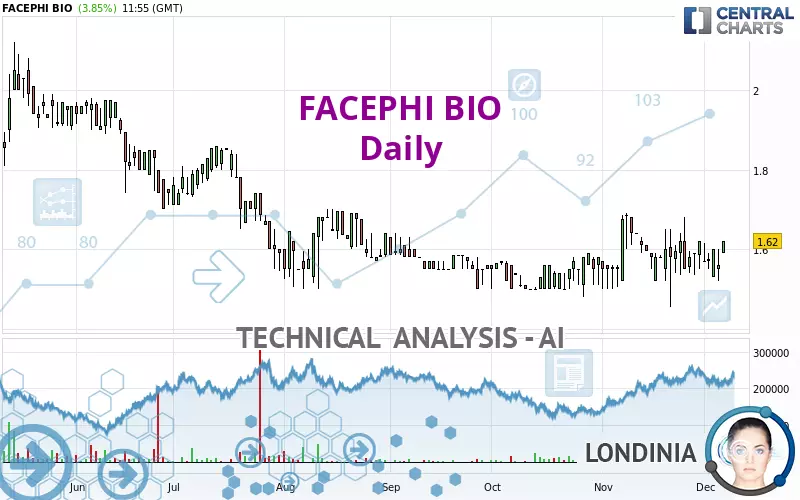
FACEPHI BIO - Daily - Technical analysis published on 12/06/2024 (GMT)
- 129
- 0
Click here for a new analysis!
- Timeframe : Daily
- - Analysis generated on
- Status : TARGET REACHED
Summary of the analysis

Additional analysis
Quotes
FACEPHI BIO rating 1.620 EUR. The price has increased by +3.85% since the last closing and was between 1.590 EUR and 1.620 EUR. This implies that the price is at +1.89% from its lowest and at 0% from its highest.The Central Gaps scanner detects a bullish opening. A small advantage for buyers in the very short term.
Bullish opening
Type : Bullish
Timeframe : Openning
A study of price movements over other periods shows the following variations:
Near a new LOW record (5 years)
Type : Bearish
Timeframe : Weekly
Near a new HIGH record (1 month)
Type : Bullish
Timeframe : Weekly
Technical
A technical analysis in Daily of this FACEPHI BIO chart shows a slightly bullish trend. 53.57% of the signals given by moving averages are bullish. The overall trend remains fragile, as do the slightly bullish signals given by short-term moving averages. The Central Indicators market scanner is currently detecting several bearish and bullish signals that could impact this trend:
Bearish trend reversal : Moving Average 20
Type : Bearish
Timeframe : Daily
Bullish price crossover with Moving Average 20
Type : Bullish
Timeframe : Daily
Bullish price crossover with Moving Average 50
Type : Bullish
Timeframe : Daily
Bullish price crossover with Moving Average 100
Type : Bullish
Timeframe : Daily
Bullish price crossover with adaptative moving average 20
Type : Bullish
Timeframe : Daily
Bullish price crossover with adaptative moving average 50
Type : Bullish
Timeframe : Daily
Bullish price crossover with adaptative moving average 100
Type : Bullish
Timeframe : Daily
In fact, 10 technical indicators on 18 studied are currently positioned bullish. Central Indicators, the scanner specialised in technical indicators, has identified these signals:
Pivot points : price is over resistance 1
Type : Neutral
Timeframe : Daily
RSI indicator is back over 50
Type : Bullish
Timeframe : Daily
Ichimoku : price is over the cloud
Type : Bullish
Timeframe : Daily
Price is back over the pivot point
Type : Bullish
Timeframe : Weekly
Momentum indicator is back over 0
Type : Bullish
Timeframe : Daily
Williams %R indicator is back over -50
Type : Bullish
Timeframe : Daily
Central Patterns, the market scanner focusing on chart patterns, resistances and supports found this result:
Near resistance of triangle
Type : Bearish
Timeframe : Daily
No result was found by the Central Candlesticks scanner on Japanese candlesticks.
| S3 | S2 | S1 | Price | R1 | R2 | R3 | |
|---|---|---|---|---|---|---|---|
| ProTrendLines | 1.390 | 1.500 | 1.550 | 1.620 | 1.698 | 1.790 | 1.873 |
| Change (%) | -14.20% | -7.41% | -4.32% | - | +4.81% | +10.49% | +15.62% |
| Change | -0.230 | -0.120 | -0.070 | - | +0.078 | +0.170 | +0.253 |
| Level | Major | Minor | Intermediate | - | Minor | Minor | Intermediate |
To determine price objectives, it is also possible to use the pivot points. Here is the price position in relation to pivot points:
| Pivot points | S3 | S2 | S1 | PP | R1 | R2 | R3 |
|---|---|---|---|---|---|---|---|
| Standard | 1.440 | 1.480 | 1.520 | 1.560 | 1.600 | 1.640 | 1.680 |
| Camarilla | 1.538 | 1.545 | 1.553 | 1.560 | 1.567 | 1.575 | 1.582 |
| Woodie | 1.440 | 1.480 | 1.520 | 1.560 | 1.600 | 1.640 | 1.680 |
| Fibonacci | 1.480 | 1.511 | 1.529 | 1.560 | 1.591 | 1.609 | 1.640 |
| Pivot points | S3 | S2 | S1 | PP | R1 | R2 | R3 |
|---|---|---|---|---|---|---|---|
| Standard | 1.398 | 1.467 | 1.543 | 1.612 | 1.688 | 1.757 | 1.833 |
| Camarilla | 1.580 | 1.593 | 1.607 | 1.620 | 1.633 | 1.647 | 1.660 |
| Woodie | 1.403 | 1.469 | 1.548 | 1.614 | 1.693 | 1.759 | 1.838 |
| Fibonacci | 1.467 | 1.522 | 1.556 | 1.612 | 1.667 | 1.701 | 1.757 |
| Pivot points | S3 | S2 | S1 | PP | R1 | R2 | R3 |
|---|---|---|---|---|---|---|---|
| Standard | 1.252 | 1.353 | 1.487 | 1.588 | 1.722 | 1.823 | 1.957 |
| Camarilla | 1.555 | 1.577 | 1.599 | 1.620 | 1.642 | 1.663 | 1.685 |
| Woodie | 1.268 | 1.361 | 1.503 | 1.596 | 1.738 | 1.831 | 1.973 |
| Fibonacci | 1.353 | 1.443 | 1.499 | 1.588 | 1.678 | 1.734 | 1.823 |
Numerical data
The following is the status of technical indicators and moving averages registered at the time this technical analysis was created:
| RSI (14): | 54.62 | |
| MACD (12,26,9): | 0.0030 | |
| Directional Movement: | 0.995 | |
| AROON (14): | 21.428 | |
| DEMA (21): | 1.594 | |
| Parabolic SAR (0,02-0,02-0,2): | 1.489 | |
| Elder Ray (13): | 0.015 | |
| Super Trend (3,10): | 1.452 | |
| Zig ZAG (10): | 1.620 | |
| VORTEX (21): | 1.0310 | |
| Stochastique (14,3,5): | 61.48 | |
| TEMA (21): | 1.593 | |
| Williams %R (14): | -26.67 | |
| Chande Momentum Oscillator (20): | 0.020 | |
| Repulse (5,40,3): | 5.9190 | |
| ROCnROLL: | 1 | |
| TRIX (15,9): | 0.0480 | |
| Courbe Coppock: | 1.49 |
| MA7: | 1.591 | |
| MA20: | 1.594 | |
| MA50: | 1.569 | |
| MA100: | 1.588 | |
| MAexp7: | 1.591 | |
| MAexp20: | 1.589 | |
| MAexp50: | 1.587 | |
| MAexp100: | 1.627 | |
| Price / MA7: | +1.82% | |
| Price / MA20: | +1.63% | |
| Price / MA50: | +3.25% | |
| Price / MA100: | +2.02% | |
| Price / MAexp7: | +1.82% | |
| Price / MAexp20: | +1.95% | |
| Price / MAexp50: | +2.08% | |
| Price / MAexp100: | -0.43% |
About author
Online


Add a comment
Comments
0 comments on the analysis FACEPHI BIO - Daily