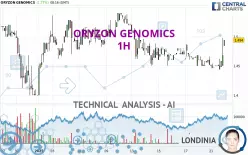
ORYZON GENOMICS - 1H - Technical analysis published on 01/22/2025 (GMT)
- 184
- 0
Click here for a new analysis!
- Timeframe : 1H
- - Analysis generated on
- Status : INVALID

Summary of the analysis

Additional analysis
Quotes
The ORYZON GENOMICS price is 1.494 EUR. The price registered an increase of +1.77% on the session with the lowest point at 1.484 EUR and the highest point at 1.494 EUR. The deviation from the price is +0.67% for the low point and 0% for the high point.A bullish opening was detected by the Central Gaps scanner. Buyers are trying to impose a bullish momentum in the very short term.
Bullish opening
Type : Bullish
Timeframe : Openning
Here is a more detailed summary of the historical variations registered by ORYZON GENOMICS:
Near a new LOW record (5 years)
Type : Bearish
Timeframe : Weekly
Near a new LOW record (1 year)
Type : Bearish
Timeframe : Weekly
Near a new LOW record (1st january)
Type : Bearish
Timeframe : Weekly
Near a new HIGH record (1 month)
Type : Bullish
Timeframe : Weekly
Technical
Technical analysis of this 1H chart of ORYZON GENOMICS indicates that the overall trend is not clearly defined. This indecision could turn into a bullish trend due to the strong bullish signals currently being given by short-term moving averages. The Central Indicators scanner detects bullish signals on moving averages that could impact this trend:
Bullish trend reversal : Moving Average 20
Type : Bullish
Timeframe : 1 hour
Bullish trend reversal : adaptative moving average 50
Type : Bullish
Timeframe : 1 hour
Bullish price crossover with Moving Average 100
Type : Bullish
Timeframe : 1 hour
Bullish price crossover with adaptative moving average 50
Type : Bullish
Timeframe : 1 hour
Bullish price crossover with adaptative moving average 100
Type : Bullish
Timeframe : 1 hour
In fact, according to the parameters integrated into the Central Analyzer system, only 9 technical indicators out of 18 analysed are currently bullish. But beware of excesses. The Central Indicators scanner currently detects this:
CCI indicator is overbought : over 100
Type : Neutral
Timeframe : 1 hour
Williams %R indicator is back under -50
Type : Bearish
Timeframe : 1 hour
The Central Patterns scanner, which studies chart patterns, resistances and supports, has identified these signals:
Near horizontal resistance
Type : Bearish
Timeframe : 1 hour
Resistance of channel is broken
Type : Bullish
Timeframe : 1 hour
Central Candlesticks, the scanner specialised in Japanese candlesticks, detects this inversion signal that could impact the current short-term trend:
Doji
Type : Neutral
Timeframe : 1 hour
| S3 | S2 | S1 | Price | R1 | R2 | R3 | |
|---|---|---|---|---|---|---|---|
| ProTrendLines | 1.400 | 1.450 | 1.484 | 1.494 | 1.524 | 1.605 | 1.732 |
| Change (%) | -6.29% | -2.95% | -0.67% | - | +2.01% | +7.43% | +15.93% |
| Change | -0.094 | -0.044 | -0.010 | - | +0.030 | +0.111 | +0.238 |
| Level | Major | Intermediate | Intermediate | - | Major | Major | Minor |
Attention could also be paid to pivot points to set price objectives:
| Pivot points | S3 | S2 | S1 | PP | R1 | R2 | R3 |
|---|---|---|---|---|---|---|---|
| Standard | 1.388 | 1.416 | 1.442 | 1.470 | 1.496 | 1.524 | 1.550 |
| Camarilla | 1.453 | 1.458 | 1.463 | 1.468 | 1.473 | 1.478 | 1.483 |
| Woodie | 1.387 | 1.416 | 1.441 | 1.470 | 1.495 | 1.524 | 1.549 |
| Fibonacci | 1.416 | 1.437 | 1.449 | 1.470 | 1.491 | 1.503 | 1.524 |
| Pivot points | S3 | S2 | S1 | PP | R1 | R2 | R3 |
|---|---|---|---|---|---|---|---|
| Standard | 1.366 | 1.408 | 1.436 | 1.478 | 1.506 | 1.548 | 1.576 |
| Camarilla | 1.445 | 1.451 | 1.458 | 1.464 | 1.470 | 1.477 | 1.483 |
| Woodie | 1.359 | 1.405 | 1.429 | 1.475 | 1.499 | 1.545 | 1.569 |
| Fibonacci | 1.408 | 1.435 | 1.451 | 1.478 | 1.505 | 1.521 | 1.548 |
| Pivot points | S3 | S2 | S1 | PP | R1 | R2 | R3 |
|---|---|---|---|---|---|---|---|
| Standard | 0.979 | 1.189 | 1.295 | 1.505 | 1.611 | 1.821 | 1.927 |
| Camarilla | 1.313 | 1.342 | 1.371 | 1.400 | 1.429 | 1.458 | 1.487 |
| Woodie | 0.926 | 1.163 | 1.242 | 1.479 | 1.558 | 1.795 | 1.874 |
| Fibonacci | 1.189 | 1.310 | 1.385 | 1.505 | 1.626 | 1.701 | 1.821 |
Numerical data
The following is the status of the technical indicators and moving averages at the time of publication of this technical analysis:
| RSI (14): | 56.84 | |
| MACD (12,26,9): | -0.0030 | |
| Directional Movement: | 32.413 | |
| AROON (14): | 14.286 | |
| DEMA (21): | 1.451 | |
| Parabolic SAR (0,02-0,02-0,2): | 1.445 | |
| Elder Ray (13): | 0.019 | |
| Super Trend (3,10): | 1.439 | |
| Zig ZAG (10): | 1.468 | |
| VORTEX (21): | 0.8350 | |
| Stochastique (14,3,5): | 36.03 | |
| TEMA (21): | 1.453 | |
| Williams %R (14): | -55.56 | |
| Chande Momentum Oscillator (20): | 0.018 | |
| Repulse (5,40,3): | 0.3760 | |
| ROCnROLL: | -1 | |
| TRIX (15,9): | -0.0510 | |
| Courbe Coppock: | 0.54 |
| MA7: | 1.469 | |
| MA20: | 1.484 | |
| MA50: | 1.546 | |
| MA100: | 1.666 | |
| MAexp7: | 1.456 | |
| MAexp20: | 1.456 | |
| MAexp50: | 1.465 | |
| MAexp100: | 1.478 | |
| Price / MA7: | +1.70% | |
| Price / MA20: | +0.67% | |
| Price / MA50: | -3.36% | |
| Price / MA100: | -10.32% | |
| Price / MAexp7: | +2.61% | |
| Price / MAexp20: | +2.61% | |
| Price / MAexp50: | +1.98% | |
| Price / MAexp100: | +1.08% |
News
The last news published on ORYZON GENOMICS at the time of the generation of this analysis was as follows:
- ORYZON announces appointment of Dr. Pierre Beaurang as Strategy and Business Development Advisor
- ORYZON Announces First Patient Dosed in NCI-Sponsored Iadademstat in Combination With Venetoclax and Azacitidine Clinical Trial in First Line Acute Myeloid Leukemia
- ORYZON to Provide Corporate Progress Updates at Several Events in January-February
-
 Oryzon Genomics – executive interview (10 December 2024)
- ORYZON Continues to Strengthen its Patent Portfolio for Vafidemstat
About author
Online


Add a comment
Comments
0 comments on the analysis ORYZON GENOMICS - 1H