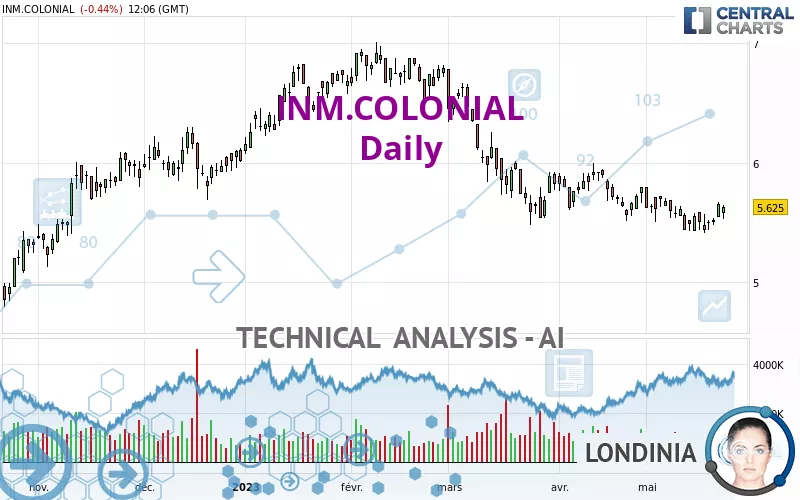
INM.COLONIAL - Daily - Technical analysis published on 05/24/2023 (GMT)
- 131
- 0
Click here for a new analysis!
- Timeframe : Daily
- - Analysis generated on
- Status : LEVEL MAINTAINED
Summary of the analysis

Additional analysis
Quotes
INM.COLONIAL rating 5.625 EUR. The price registered a decrease of -0.44% on the session and was traded between 5.525 EUR and 5.645 EUR over the period. The price is currently at +1.81% from its lowest and -0.35% from its highest.The Central Gaps scanner detects a bearish opening. A small advantage for sellers in the very short term.
Bearish opening
Type : Bearish
Timeframe : Openning
Here is a more detailed summary of the historical variations registered by INM.COLONIAL:
Near a new LOW record (1st january)
Type : Bearish
Timeframe : Weekly
Near a new HIGH record (1 month)
Type : Bullish
Timeframe : Weekly
Technical
A technical analysis in Daily of this INM.COLONIAL chart shows a bearish trend. The signals given by moving averages are 71.43% bearish. This bearish trend could slow down given the neutral signals currently being given by short-term moving averages. The Central Indicators scanner detects bullish signals on moving averages that could impact this trend:
Bullish trend reversal : Moving Average 20
Type : Bullish
Timeframe : Daily
Bullish trend reversal : adaptative moving average 20
Type : Bullish
Timeframe : Daily
The technical indicators are bullish. There is still some doubt about the price increase.
Central Indicators, the detector scanner for these technical indicators has recently detected several signals:
Pivot points : price is over resistance 1
Type : Neutral
Timeframe : Weekly
RSI indicator is back under 50
Type : Bearish
Timeframe : Daily
Price is back over the pivot point
Type : Bullish
Timeframe : Daily
Central Patterns, the market scanner focusing on chart patterns, resistances and supports found this result:
Near support of channel
Type : Bullish
Timeframe : Daily
The Central Candlesticks scanner which studies Japanese candlesticks did not detect anything.
| S3 | S2 | S1 | Price | R1 | R2 | R3 | |
|---|---|---|---|---|---|---|---|
| ProTrendLines | 4.664 | 5.140 | 5.548 | 5.625 | 6.262 | 6.668 | 7.046 |
| Change (%) | -17.08% | -8.62% | -1.37% | - | +11.32% | +18.54% | +25.26% |
| Change | -0.961 | -0.485 | -0.077 | - | +0.637 | +1.043 | +1.421 |
| Level | Major | Minor | Major | - | Minor | Minor | Major |
To determine price objectives, it is also possible to use the pivot points. Here is the price position in relation to pivot points:
| Pivot points | S3 | S2 | S1 | PP | R1 | R2 | R3 |
|---|---|---|---|---|---|---|---|
| Standard | 5.442 | 5.493 | 5.572 | 5.623 | 5.702 | 5.753 | 5.832 |
| Camarilla | 5.614 | 5.626 | 5.638 | 5.650 | 5.662 | 5.674 | 5.686 |
| Woodie | 5.455 | 5.500 | 5.585 | 5.630 | 5.715 | 5.760 | 5.845 |
| Fibonacci | 5.493 | 5.543 | 5.574 | 5.623 | 5.673 | 5.704 | 5.753 |
| Pivot points | S3 | S2 | S1 | PP | R1 | R2 | R3 |
|---|---|---|---|---|---|---|---|
| Standard | 5.238 | 5.327 | 5.413 | 5.502 | 5.588 | 5.677 | 5.763 |
| Camarilla | 5.452 | 5.468 | 5.484 | 5.500 | 5.516 | 5.532 | 5.548 |
| Woodie | 5.238 | 5.326 | 5.413 | 5.501 | 5.588 | 5.676 | 5.763 |
| Fibonacci | 5.327 | 5.394 | 5.435 | 5.502 | 5.569 | 5.610 | 5.677 |
| Pivot points | S3 | S2 | S1 | PP | R1 | R2 | R3 |
|---|---|---|---|---|---|---|---|
| Standard | 5.062 | 5.288 | 5.542 | 5.768 | 6.022 | 6.248 | 6.502 |
| Camarilla | 5.663 | 5.707 | 5.751 | 5.795 | 5.839 | 5.883 | 5.927 |
| Woodie | 5.075 | 5.295 | 5.555 | 5.775 | 6.035 | 6.255 | 6.515 |
| Fibonacci | 5.288 | 5.472 | 5.585 | 5.768 | 5.952 | 6.065 | 6.248 |
Numerical data
The following are the details of the technical indicators and moving averages that were collected to generate this technical analysis:
| RSI (14): | 48.73 | |
| MACD (12,26,9): | -0.0630 | |
| Directional Movement: | -2.407 | |
| AROON (14): | -64.286 | |
| DEMA (21): | 5.507 | |
| Parabolic SAR (0,02-0,02-0,2): | 5.420 | |
| Elder Ray (13): | 0.012 | |
| Super Trend (3,10): | 5.850 | |
| Zig ZAG (10): | 5.625 | |
| VORTEX (21): | 0.9350 | |
| Stochastique (14,3,5): | 59.14 | |
| TEMA (21): | 5.540 | |
| Williams %R (14): | -32.26 | |
| Chande Momentum Oscillator (20): | -0.055 | |
| Repulse (5,40,3): | 2.9800 | |
| ROCnROLL: | -1 | |
| TRIX (15,9): | -0.1970 | |
| Courbe Coppock: | 3.89 |
| MA7: | 5.541 | |
| MA20: | 5.595 | |
| MA50: | 5.714 | |
| MA100: | 6.161 | |
| MAexp7: | 5.568 | |
| MAexp20: | 5.600 | |
| MAexp50: | 5.767 | |
| MAexp100: | 5.927 | |
| Price / MA7: | +1.52% | |
| Price / MA20: | +0.54% | |
| Price / MA50: | -1.56% | |
| Price / MA100: | -8.70% | |
| Price / MAexp7: | +1.02% | |
| Price / MAexp20: | +0.45% | |
| Price / MAexp50: | -2.46% | |
| Price / MAexp100: | -5.10% |
News
The last news published on INM.COLONIAL at the time of the generation of this analysis was as follows:
About author
Online


Add a comment
Comments
0 comments on the analysis INM.COLONIAL - Daily