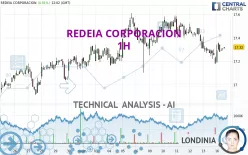
REDEIA CORPORACION - 1H - Technical analysis published on 09/16/2024 (GMT)
- 162
- 0
- Timeframe : 1H
- - Analysis generated on
- Status : NEUTRAL

Summary of the analysis

Additional analysis
Quotes
The REDEIA CORPORACION price is 17.32 EUR. The price registered an increase of +0.82% on the session with the lowest point at 17.19 EUR and the highest point at 17.36 EUR. The deviation from the price is +0.76% for the low point and -0.23% for the high point.The Central Gaps scanner detects a bullish opening marking the presence of buyers ahead of sellers at the opening but not sufficiently marked to allow the price to register a quotation gap.
Bullish opening
Type : Bullish
Timeframe : Openning
So that you have an overall view of the price change, here is a table showing the variations over several periods:
Near a new HIGH record (5 years)
Type : Bullish
Timeframe : Weekly
Near a new HIGH record (1 year)
Type : Bullish
Timeframe : Weekly
Near a new HIGH record (1st january)
Type : Bullish
Timeframe : Weekly
Near a new LOW record (1 month)
Type : Bearish
Timeframe : Weekly
Technical
A technical analysis in 1H of this REDEIA CORPORACION chart shows a slightly bearish trend. Only 53.57% of the signals given by moving averages are bearish. This slightly bearish trend could return to neutral given the neutral signals also given by short-term moving averages. The Central Indicators market scanner currently does not detect any result that concerns moving averages.
Technical indicators are slightly bullish. There is therefore considerable uncertainty about the continuation of the increase.
The Central Indicators scanner found this result concerning these indicators:
Williams %R indicator is back over -50
Type : Bullish
Timeframe : 1 hour
The Central Patterns scanner, which studies chart patterns, resistances and supports, has identified this signal:
Near support of channel
Type : Bullish
Timeframe : 1 hour
No result was found by the Central Candlesticks scanner on Japanese candlesticks.
| S3 | S2 | S1 | Price | R1 | R2 | R3 | |
|---|---|---|---|---|---|---|---|
| ProTrendLines | 16.91 | 17.10 | 17.23 | 17.32 | 17.40 | 17.48 | 17.58 |
| Change (%) | -2.37% | -1.27% | -0.52% | - | +0.46% | +0.92% | +1.50% |
| Change | -0.41 | -0.22 | -0.09 | - | +0.08 | +0.16 | +0.26 |
| Level | Intermediate | Minor | Minor | - | Major | Minor | Major |
To determine price objectives, it is also possible to use the pivot points. Here is the price position in relation to pivot points:
| Pivot points | S3 | S2 | S1 | PP | R1 | R2 | R3 |
|---|---|---|---|---|---|---|---|
| Standard | 16.87 | 17.03 | 17.10 | 17.26 | 17.33 | 17.49 | 17.56 |
| Camarilla | 17.12 | 17.14 | 17.16 | 17.18 | 17.20 | 17.22 | 17.24 |
| Woodie | 16.84 | 17.01 | 17.07 | 17.24 | 17.30 | 17.47 | 17.53 |
| Fibonacci | 17.03 | 17.12 | 17.17 | 17.26 | 17.35 | 17.40 | 17.49 |
| Pivot points | S3 | S2 | S1 | PP | R1 | R2 | R3 |
|---|---|---|---|---|---|---|---|
| Standard | 16.63 | 16.91 | 17.04 | 17.32 | 17.45 | 17.73 | 17.86 |
| Camarilla | 17.07 | 17.11 | 17.14 | 17.18 | 17.22 | 17.26 | 17.29 |
| Woodie | 16.57 | 16.87 | 16.98 | 17.28 | 17.39 | 17.69 | 17.80 |
| Fibonacci | 16.91 | 17.06 | 17.16 | 17.32 | 17.47 | 17.57 | 17.73 |
| Pivot points | S3 | S2 | S1 | PP | R1 | R2 | R3 |
|---|---|---|---|---|---|---|---|
| Standard | 14.82 | 15.32 | 16.25 | 16.75 | 17.68 | 18.18 | 19.11 |
| Camarilla | 16.79 | 16.92 | 17.05 | 17.18 | 17.31 | 17.44 | 17.57 |
| Woodie | 15.04 | 15.43 | 16.47 | 16.86 | 17.90 | 18.29 | 19.33 |
| Fibonacci | 15.32 | 15.87 | 16.20 | 16.75 | 17.30 | 17.63 | 18.18 |
Numerical data
The following is the status of technical indicators and moving averages registered at the time this technical analysis was created:
| RSI (14): | 44.75 | |
| MACD (12,26,9): | -0.0400 | |
| Directional Movement: | -5.59 | |
| AROON (14): | -57.15 | |
| DEMA (21): | 17.27 | |
| Parabolic SAR (0,02-0,02-0,2): | 17.20 | |
| Elder Ray (13): | 0 | |
| Super Trend (3,10): | 17.38 | |
| Zig ZAG (10): | 17.30 | |
| VORTEX (21): | 0.8700 | |
| Stochastique (14,3,5): | 46.67 | |
| TEMA (21): | 17.25 | |
| Williams %R (14): | -47.83 | |
| Chande Momentum Oscillator (20): | 0.00 | |
| Repulse (5,40,3): | -0.1500 | |
| ROCnROLL: | -1 | |
| TRIX (15,9): | -0.0400 | |
| Courbe Coppock: | 1.06 |
| MA7: | 17.37 | |
| MA20: | 17.21 | |
| MA50: | 16.72 | |
| MA100: | 16.35 | |
| MAexp7: | 17.30 | |
| MAexp20: | 17.32 | |
| MAexp50: | 17.36 | |
| MAexp100: | 17.31 | |
| Price / MA7: | -0.29% | |
| Price / MA20: | +0.64% | |
| Price / MA50: | +3.59% | |
| Price / MA100: | +5.93% | |
| Price / MAexp7: | +0.12% | |
| Price / MAexp20: | -0% | |
| Price / MAexp50: | -0.23% | |
| Price / MAexp100: | +0.06% |
News
The latest news and videos published on REDEIA CORPORACION at the time of the analysis were as follows:
About author
Online


Add a comment
Comments
0 comments on the analysis REDEIA CORPORACION - 1H