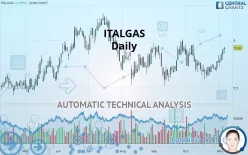
ITALGAS - Daily - Technical analysis published on 11/07/2019 (GMT)
- 317
- 0
- Who voted?
Click here for a new analysis!
- Timeframe : Daily
- - Analysis generated on
- Status : TARGET REACHED

Summary of the analysis

Additional analysis
Quotes
The ITALGAS price is 5.920 EUR. On the day, this instrument gained +0.31% with the lowest point at 5.862 EUR and the highest point at 5.928 EUR. The deviation from the price is +0.99% for the low point and -0.13% for the high point.The Central Gaps scanner detects a bullish opening. A small advantage for buyers in the very short term.
Bullish opening
Type : Bullish
Timeframe : Openning
Here is a more detailed summary of the historical variations registered by ITALGAS:
Technical
Technical analysis of ITALGAS in Daily shows an overall bullish trend. 67.86% of the signals given by moving averages are bullish. This bullish trend is supported by the strong bullish signals given by short-term moving averages. The Central Indicators market scanner is currently detecting a bullish signal that could impact this trend:
Bullish price crossover with adaptative moving average 50
Type : Bullish
Timeframe : Daily
In fact, according to the parameters integrated into the Central Analyzer system, 16 technical indicators out of 18 analysed are currently bullish. But beware of excesses. The Central Indicators scanner currently detects this:
CCI indicator is overbought : over 100
Type : Neutral
Timeframe : Daily
Williams %R indicator is overbought : over -20
Type : Neutral
Timeframe : Daily
Pivot points : price is over resistance 1
Type : Neutral
Timeframe : Daily
Pivot points : price is over resistance 1
Type : Neutral
Timeframe : Weekly
MACD indicator is back over 0
Type : Bullish
Timeframe : Daily
An analysis of the price chart with the Central Patterns scanner (detector of chart patterns and resistances and supports) shows several results that can have an impact on the price change:
Near resistance of channel
Type : Bearish
Timeframe : Daily
Resistance of triangle is broken
Type : Bullish
Timeframe : Daily
No result was found by the Central Candlesticks scanner on Japanese candlesticks.
| S3 | S2 | S1 | Price | R1 | R2 | R3 | |
|---|---|---|---|---|---|---|---|
| ProTrendLines | 5.361 | 5.586 | 5.727 | 5.920 | 5.974 | 6.122 | 6.228 |
| Change (%) | -9.44% | -5.64% | -3.26% | - | +0.91% | +3.41% | +5.20% |
| Change | -0.559 | -0.334 | -0.193 | - | +0.054 | +0.202 | +0.308 |
| Level | Major | Major | Intermediate | - | Major | Minor | Major |
Pivot points can also be used to set your price objectives. Here is the price situation in relation to pivot points:
| Pivot points | S3 | S2 | S1 | PP | R1 | R2 | R3 |
|---|---|---|---|---|---|---|---|
| Standard | 5.693 | 5.735 | 5.789 | 5.831 | 5.885 | 5.927 | 5.981 |
| Camarilla | 5.818 | 5.826 | 5.835 | 5.844 | 5.853 | 5.862 | 5.870 |
| Woodie | 5.700 | 5.738 | 5.796 | 5.834 | 5.892 | 5.930 | 5.988 |
| Fibonacci | 5.735 | 5.771 | 5.794 | 5.831 | 5.867 | 5.890 | 5.927 |
| Pivot points | S3 | S2 | S1 | PP | R1 | R2 | R3 |
|---|---|---|---|---|---|---|---|
| Standard | 5.497 | 5.551 | 5.641 | 5.695 | 5.785 | 5.839 | 5.929 |
| Camarilla | 5.690 | 5.704 | 5.717 | 5.730 | 5.743 | 5.756 | 5.770 |
| Woodie | 5.514 | 5.560 | 5.658 | 5.704 | 5.802 | 5.848 | 5.946 |
| Fibonacci | 5.551 | 5.606 | 5.640 | 5.695 | 5.750 | 5.784 | 5.839 |
| Pivot points | S3 | S2 | S1 | PP | R1 | R2 | R3 |
|---|---|---|---|---|---|---|---|
| Standard | 5.205 | 5.395 | 5.581 | 5.771 | 5.957 | 6.147 | 6.333 |
| Camarilla | 5.665 | 5.699 | 5.734 | 5.768 | 5.803 | 5.837 | 5.871 |
| Woodie | 5.204 | 5.394 | 5.580 | 5.770 | 5.956 | 6.146 | 6.332 |
| Fibonacci | 5.395 | 5.538 | 5.627 | 5.771 | 5.914 | 6.003 | 6.147 |
Numerical data
The following are the details of the technical indicators and moving averages that were collected to generate this technical analysis:
| RSI (14): | 61.13 | |
| MACD (12,26,9): | 0.0120 | |
| Directional Movement: | 5.379 | |
| AROON (14): | 85.714 | |
| DEMA (21): | 5.773 | |
| Parabolic SAR (0,02-0,02-0,2): | 5.624 | |
| Elder Ray (13): | 0.071 | |
| Super Trend (3,10): | 5.598 | |
| Zig ZAG (10): | 5.902 | |
| VORTEX (21): | 0.9730 | |
| Stochastique (14,3,5): | 89.99 | |
| TEMA (21): | 5.798 | |
| Williams %R (14): | 0.00 | |
| Chande Momentum Oscillator (20): | 0.224 | |
| Repulse (5,40,3): | 3.0160 | |
| ROCnROLL: | 1 | |
| TRIX (15,9): | -0.0290 | |
| Courbe Coppock: | 2.58 |
| MA7: | 5.784 | |
| MA20: | 5.734 | |
| MA50: | 5.774 | |
| MA100: | 5.857 | |
| MAexp7: | 5.805 | |
| MAexp20: | 5.767 | |
| MAexp50: | 5.777 | |
| MAexp100: | 5.764 | |
| Price / MA7: | +2.35% | |
| Price / MA20: | +3.24% | |
| Price / MA50: | +2.53% | |
| Price / MA100: | +1.08% | |
| Price / MAexp7: | +1.98% | |
| Price / MAexp20: | +2.65% | |
| Price / MAexp50: | +2.48% | |
| Price / MAexp100: | +2.71% |
About author

Online


Add a comment
Comments
0 comments on the analysis ITALGAS - Daily