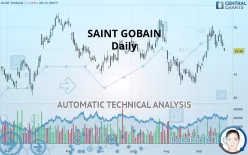
SAINT GOBAIN - Daily - Technical analysis published on 09/25/2019 (GMT)
- 389
- 0
- Who voted?
Click here for a new analysis!
- Timeframe : Daily
- - Analysis generated on
- Status : TARGET REACHED

Summary of the analysis

Additional analysis
Quotes
The SAINT GOBAIN rating is 33.960 EUR. On the day, this instrument lost -1.24% with the lowest point at 33.900 EUR and the highest point at 34.225 EUR. The deviation from the price is +0.18% for the low point and -0.77% for the high point.A bearish gap was detected at the opening by the Central Gaps scanner. There are a lot of sellers and they have the upper hand in the very short term.
Opening Gap DOWN
Type : Bearish
Timeframe : Openning
Here is a more detailed summary of the historical variations registered by SAINT GOBAIN:
Technical
A technical analysis in Daily of this SAINT GOBAIN chart shows a bullish trend. 67.86% of the signals given by moving averages are bullish. Caution: the neutral signals currently given by the short-term moving averages indicate that this bullish trend is showing signs of running out of steam. An assessment of moving averages reveals a bearish signal that could impact this trend:
Bearish trend reversal : Moving Average 50
Type : Bearish
Timeframe : Daily
The technical indicators are generally neutral. They do not provide relevant information on the direction of future price movements.
Other results related to technical indicators were also found by the Central Indicators scanner:
Pivot points : price is under support 1
Type : Neutral
Timeframe : Daily
Pivot points : price is under support 1
Type : Neutral
Timeframe : Weekly
Williams %R indicator is back under -50
Type : Bearish
Timeframe : Daily
Central Patterns, the market scanner focusing on chart patterns, resistances and supports found this result:
Horizontal support is broken
Type : Bearish
Timeframe : Daily
The Central Candlesticks scanner which studies Japanese candlesticks did not detect anything.
| S3 | S2 | S1 | Price | R1 | R2 | R3 | |
|---|---|---|---|---|---|---|---|
| ProTrendLines | 31.371 | 32.462 | 33.151 | 33.960 | 34.579 | 35.980 | 36.720 |
| Change (%) | -7.62% | -4.41% | -2.38% | - | +1.82% | +5.95% | +8.13% |
| Change | -2.589 | -1.498 | -0.809 | - | +0.619 | +2.020 | +2.760 |
| Level | Major | Major | Major | - | Major | Major | Major |
Attention could also be paid to pivot points to set price objectives:
| Pivot points | S3 | S2 | S1 | PP | R1 | R2 | R3 |
|---|---|---|---|---|---|---|---|
| Standard | 33.488 | 33.892 | 34.138 | 34.542 | 34.788 | 35.192 | 35.438 |
| Camarilla | 34.206 | 34.266 | 34.325 | 34.385 | 34.445 | 34.504 | 34.564 |
| Woodie | 33.410 | 33.853 | 34.060 | 34.503 | 34.710 | 35.153 | 35.360 |
| Fibonacci | 33.892 | 34.140 | 34.293 | 34.542 | 34.790 | 34.943 | 35.192 |
| Pivot points | S3 | S2 | S1 | PP | R1 | R2 | R3 |
|---|---|---|---|---|---|---|---|
| Standard | 32.982 | 33.608 | 34.497 | 35.123 | 36.012 | 36.638 | 37.527 |
| Camarilla | 34.968 | 35.107 | 35.246 | 35.385 | 35.524 | 35.663 | 35.802 |
| Woodie | 33.113 | 33.674 | 34.628 | 35.189 | 36.143 | 36.704 | 37.658 |
| Fibonacci | 33.608 | 34.187 | 34.545 | 35.123 | 35.702 | 36.060 | 36.638 |
| Pivot points | S3 | S2 | S1 | PP | R1 | R2 | R3 |
|---|---|---|---|---|---|---|---|
| Standard | 26.778 | 28.917 | 30.868 | 33.007 | 34.958 | 37.097 | 39.048 |
| Camarilla | 31.695 | 32.070 | 32.445 | 32.820 | 33.195 | 33.570 | 33.945 |
| Woodie | 26.685 | 28.870 | 30.775 | 32.960 | 34.865 | 37.050 | 38.955 |
| Fibonacci | 28.917 | 30.479 | 31.444 | 33.007 | 34.569 | 35.534 | 37.097 |
Numerical data
The following are the details of the technical indicators and moving averages that were collected to generate this technical analysis:
| RSI (14): | 49.15 | |
| MACD (12,26,9): | 0.4450 | |
| Directional Movement: | 0.689 | |
| AROON (14): | 42.857 | |
| DEMA (21): | 34.818 | |
| Parabolic SAR (0,02-0,02-0,2): | 36.066 | |
| Elder Ray (13): | -0.429 | |
| Super Trend (3,10): | 33.340 | |
| Zig ZAG (10): | 33.950 | |
| VORTEX (21): | 1.1030 | |
| Stochastique (14,3,5): | 40.51 | |
| TEMA (21): | 35.134 | |
| Williams %R (14): | -78.03 | |
| Chande Momentum Oscillator (20): | 0.000 | |
| Repulse (5,40,3): | -2.7700 | |
| ROCnROLL: | -1 | |
| TRIX (15,9): | 0.2250 | |
| Courbe Coppock: | 10.53 |
| MA7: | 34.695 | |
| MA20: | 34.180 | |
| MA50: | 33.633 | |
| MA100: | 33.383 | |
| MAexp7: | 34.588 | |
| MAexp20: | 34.245 | |
| MAexp50: | 33.759 | |
| MAexp100: | 33.385 | |
| Price / MA7: | -2.12% | |
| Price / MA20: | -0.64% | |
| Price / MA50: | +0.97% | |
| Price / MA100: | +1.73% | |
| Price / MAexp7: | -1.82% | |
| Price / MAexp20: | -0.83% | |
| Price / MAexp50: | +0.60% | |
| Price / MAexp100: | +1.72% |
News
Don"t forget to follow the news on SAINT GOBAIN. At the time of publication of this analysis, the latest news was as follows:
- Saint-Gobain CEO Interview - Full Year 2018 Results (video)
- Saint-Gobain Accelerates Its Transformation by Launching the "Transform & Grow Program"
- Saint-Gobain Partners With Stem, Inc. for Widespread Energy Storage Services
- MSC Industrial Supply Co. Recognizes Norton │Saint-Gobain Abrasives, Sandvik Coromant, Parker Hannifin With 'Supplier of the Year' Awards
- Saint-Gobain Acquires Wattex, the Flemish Roof Reinforcement Specialist
About author

Online


Add a comment
Comments
0 comments on the analysis SAINT GOBAIN - Daily