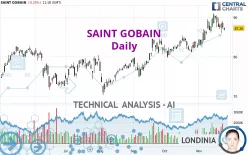
SAINT GOBAIN - Daily - Technical analysis published on 11/26/2024 (GMT)
- 107
- 0
Click here for a new analysis!
- Timeframe : Daily
- - Analysis generated on
- Status : LEVEL MAINTAINED

Summary of the analysis

Additional analysis
Quotes
The SAINT GOBAIN price is 87.26 EUR. The price registered a decrease of -0.25% on the session with the lowest point at 86.76 EUR and the highest point at 87.54 EUR. The deviation from the price is +0.58% for the low point and -0.32% for the high point.The Central Gaps scanner detects the formation of a bearish gap marking the strong presence of sellers ahead of buyers at the opening. This formed a quotation gap.
Opening Gap DOWN
Type : Bearish
Timeframe : Openning
A study of price movements over other periods shows the following variations:
Near a new HIGH record (5 years)
Type : Bullish
Timeframe : Weekly
Near a new HIGH record (1 year)
Type : Bullish
Timeframe : Weekly
Near a new HIGH record (1st january)
Type : Bullish
Timeframe : Weekly
Near a new HIGH record (1 month)
Type : Bullish
Timeframe : Weekly
Technical
A technical analysis in Daily of this SAINT GOBAIN chart shows a strongly bullish trend. 92.86% of the signals given by moving averages are bullish. The overall trend is supported by the strong bullish signals from short-term moving averages. The Central Indicators market scanner currently does not detect any result that concerns moving averages.
An assessment of technical indicators does not currently provide any relevant information to suggest whether the signal given by the technical indicators is more bullish or bearish.
Central Indicators, the scanner specialised in technical indicators, has identified this signal:
Price is back under the pivot point
Type : Bearish
Timeframe : Weekly
Central Patterns, the scanner specializing in chart patterns, did not identify any signals.
No result was found by the Central Candlesticks scanner on Japanese candlesticks.
| S3 | S2 | S1 | Price | R1 | |
|---|---|---|---|---|---|
| ProTrendLines | 71.93 | 80.48 | 84.52 | 87.26 | 90.68 |
| Change (%) | -17.57% | -7.77% | -3.14% | - | +3.92% |
| Change | -15.33 | -6.78 | -2.74 | - | +3.42 |
| Level | Major | Intermediate | Major | - | Major |
Pivot points can also be used to set your price objectives. Here is the price situation in relation to pivot points:
| Pivot points | S3 | S2 | S1 | PP | R1 | R2 | R3 |
|---|---|---|---|---|---|---|---|
| Standard | 84.79 | 85.97 | 86.73 | 87.91 | 88.67 | 89.85 | 90.61 |
| Camarilla | 86.95 | 87.12 | 87.30 | 87.48 | 87.66 | 87.84 | 88.01 |
| Woodie | 84.57 | 85.87 | 86.51 | 87.81 | 88.45 | 89.75 | 90.39 |
| Fibonacci | 85.97 | 86.71 | 87.17 | 87.91 | 88.65 | 89.11 | 89.85 |
| Pivot points | S3 | S2 | S1 | PP | R1 | R2 | R3 |
|---|---|---|---|---|---|---|---|
| Standard | 80.87 | 83.43 | 85.47 | 88.03 | 90.07 | 92.63 | 94.67 |
| Camarilla | 86.24 | 86.66 | 87.08 | 87.50 | 87.92 | 88.34 | 88.77 |
| Woodie | 80.60 | 83.30 | 85.20 | 87.90 | 89.80 | 92.50 | 94.40 |
| Fibonacci | 83.43 | 85.19 | 86.28 | 88.03 | 89.79 | 90.88 | 92.63 |
| Pivot points | S3 | S2 | S1 | PP | R1 | R2 | R3 |
|---|---|---|---|---|---|---|---|
| Standard | 74.38 | 77.06 | 80.02 | 82.70 | 85.66 | 88.34 | 91.30 |
| Camarilla | 81.43 | 81.95 | 82.46 | 82.98 | 83.50 | 84.01 | 84.53 |
| Woodie | 74.52 | 77.13 | 80.16 | 82.77 | 85.80 | 88.41 | 91.44 |
| Fibonacci | 77.06 | 79.21 | 80.55 | 82.70 | 84.85 | 86.19 | 88.34 |
Numerical data
The following is the status of the technical indicators and moving averages at the time of publication of this technical analysis:
| RSI (14): | 54.35 | |
| MACD (12,26,9): | 1.2800 | |
| Directional Movement: | 5.16 | |
| AROON (14): | 50.00 | |
| DEMA (21): | 88.67 | |
| Parabolic SAR (0,02-0,02-0,2): | 90.94 | |
| Elder Ray (13): | -0.36 | |
| Super Trend (3,10): | 84.17 | |
| Zig ZAG (10): | 87.26 | |
| VORTEX (21): | 1.0800 | |
| Stochastique (14,3,5): | 50.58 | |
| TEMA (21): | 88.74 | |
| Williams %R (14): | -56.40 | |
| Chande Momentum Oscillator (20): | 1.16 | |
| Repulse (5,40,3): | -1.0800 | |
| ROCnROLL: | -1 | |
| TRIX (15,9): | 0.2600 | |
| Courbe Coppock: | 8.47 |
| MA7: | 88.14 | |
| MA20: | 86.81 | |
| MA50: | 84.32 | |
| MA100: | 80.64 | |
| MAexp7: | 87.78 | |
| MAexp20: | 86.87 | |
| MAexp50: | 84.38 | |
| MAexp100: | 81.41 | |
| Price / MA7: | -1.00% | |
| Price / MA20: | +0.52% | |
| Price / MA50: | +3.49% | |
| Price / MA100: | +8.21% | |
| Price / MAexp7: | -0.59% | |
| Price / MAexp20: | +0.45% | |
| Price / MAexp50: | +3.41% | |
| Price / MAexp100: | +7.19% |
News
The latest news and videos published on SAINT GOBAIN at the time of the analysis were as follows:
- Saint-Gobain Video Series: Journey to 2030 - What Are LCA's?
- Saint-Gobain Video Series: Success in the Making: Adan Alencastro, Plataka, Florida
- Saint-Gobain Video Series: empowHERed: Martha Degnan, Worcester, MA
- B… for Bio-Based Materials, a Saint-Gobain Podcast
- Saint-Gobain Canada Unveils CarbonLow(TM), New Gypsum Wallboard Line with up to 60% Less Embodied Carbon
About author
Online


Add a comment
Comments
0 comments on the analysis SAINT GOBAIN - Daily