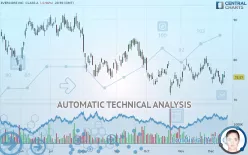
EVERCORE INC. CLASS A - Daily - Technical analysis published on 12/16/2019 (GMT)
- 350
- 0
- Who voted?
Click here for a new analysis!
- Timeframe : Daily
- - Analysis generated on
- Status : TARGET REACHED

Summary of the analysis

Additional analysis
Quotes
The EVERCORE INC. CLASS A rating is 75.57 USD. The price is lower by -0.96% since the last closing with the lowest point at 75.46 USD and the highest point at 77.08 USD. The deviation from the price is +0.15% for the low point and -1.96% for the high point.The Central Gaps scanner detects a bearish opening marking the presence of sellers ahead of buyers at the opening but not sufficiently marked to allow the price to register a quotation gap.
Bearish opening
Type : Bearish
Timeframe : Openning
So that you have an overall view of the price change, here is a table showing the variations over several periods:
Technical
Technical analysis of this Daily chart of EVERCORE INC. CLASS A indicates that the overall trend is strongly bearish. 85.71% of the signals given by moving averages are bearish. This strongly bearish trend is showing signs of slowing down given the slightly bearish signals given by short-term moving averages. The Central Indicators market scanner is currently detecting several bullish signals that could impact this trend:
Bullish trend reversal : Moving Average 20
Type : Bullish
Timeframe : Daily
Bullish price crossover with Moving Average 50
Type : Bullish
Timeframe : Daily
An assessment of technical indicators does not currently provide any relevant information to suggest whether the signal given by the technical indicators is more bullish or bearish.
Caution: the Central Indicators scanner currently detects an excess:
CCI indicator: bullish divergence
Type : Bullish
Timeframe : Daily
RSI indicator: bullish divergence
Type : Bullish
Timeframe : Daily
RSI indicator is back over 50
Type : Bullish
Timeframe : Daily
Price is back over the pivot point
Type : Bullish
Timeframe : Daily
The analysis of the price chart with Central Patterns scanners does not return any result.
The presence of a bullish Japanese candlestick pattern detected by Central Candlesticks that could cause a very short term rebound was also detected:
White morning star
Type : Bullish
Timeframe : Daily
| S3 | S2 | S1 | Price | R1 | R2 | R3 | |
|---|---|---|---|---|---|---|---|
| ProTrendLines | 52.82 | 64.90 | 73.36 | 75.57 | 75.91 | 83.02 | 84.97 |
| Change (%) | -30.10% | -14.12% | -2.92% | - | +0.45% | +9.86% | +12.44% |
| Change | -22.75 | -10.67 | -2.21 | - | +0.34 | +7.45 | +9.40 |
| Level | Intermediate | Major | Intermediate | - | Major | Intermediate | Minor |
Pivot points can also be used to set your price objectives. Here is the price situation in relation to pivot points:
| Pivot points | S3 | S2 | S1 | PP | R1 | R2 | R3 |
|---|---|---|---|---|---|---|---|
| Standard | 72.51 | 73.27 | 74.79 | 75.55 | 77.07 | 77.83 | 79.35 |
| Camarilla | 75.67 | 75.88 | 76.09 | 76.30 | 76.51 | 76.72 | 76.93 |
| Woodie | 72.88 | 73.46 | 75.16 | 75.74 | 77.44 | 78.02 | 79.72 |
| Fibonacci | 73.27 | 74.14 | 74.68 | 75.55 | 76.42 | 76.96 | 77.83 |
| Pivot points | S3 | S2 | S1 | PP | R1 | R2 | R3 |
|---|---|---|---|---|---|---|---|
| Standard | 70.70 | 72.36 | 74.75 | 76.41 | 78.80 | 80.46 | 82.85 |
| Camarilla | 76.04 | 76.41 | 76.78 | 77.15 | 77.52 | 77.89 | 78.26 |
| Woodie | 71.08 | 72.54 | 75.13 | 76.59 | 79.18 | 80.64 | 83.23 |
| Fibonacci | 72.36 | 73.90 | 74.86 | 76.41 | 77.95 | 78.91 | 80.46 |
| Pivot points | S3 | S2 | S1 | PP | R1 | R2 | R3 |
|---|---|---|---|---|---|---|---|
| Standard | 67.29 | 70.46 | 73.92 | 77.10 | 80.55 | 83.73 | 87.18 |
| Camarilla | 75.56 | 76.16 | 76.77 | 77.38 | 77.99 | 78.60 | 79.20 |
| Woodie | 67.43 | 70.54 | 74.06 | 77.17 | 80.70 | 83.80 | 87.33 |
| Fibonacci | 70.46 | 73.00 | 74.56 | 77.10 | 79.63 | 81.19 | 83.73 |
Numerical data
The following are the details of the technical indicators and moving averages that were collected to generate this technical analysis:
| RSI (14): | 47.54 | |
| MACD (12,26,9): | -0.3000 | |
| Directional Movement: | 1.27 | |
| AROON (14): | -71.42 | |
| DEMA (21): | 75.80 | |
| Parabolic SAR (0,02-0,02-0,2): | 79.09 | |
| Elder Ray (13): | 0.34 | |
| Super Trend (3,10): | 79.09 | |
| Zig ZAG (10): | 75.57 | |
| VORTEX (21): | 1.0100 | |
| Stochastique (14,3,5): | 24.68 | |
| TEMA (21): | 75.63 | |
| Williams %R (14): | -70.99 | |
| Chande Momentum Oscillator (20): | -3.04 | |
| Repulse (5,40,3): | -0.7500 | |
| ROCnROLL: | 2 | |
| TRIX (15,9): | -0.0100 | |
| Courbe Coppock: | 3.99 |
| MA7: | 75.59 | |
| MA20: | 76.46 | |
| MA50: | 75.88 | |
| MA100: | 77.78 | |
| MAexp7: | 75.63 | |
| MAexp20: | 76.10 | |
| MAexp50: | 76.68 | |
| MAexp100: | 78.17 | |
| Price / MA7: | -0.03% | |
| Price / MA20: | -1.16% | |
| Price / MA50: | -0.41% | |
| Price / MA100: | -2.84% | |
| Price / MAexp7: | -0.08% | |
| Price / MAexp20: | -0.70% | |
| Price / MAexp50: | -1.45% | |
| Price / MAexp100: | -3.33% |
News
The last news published on EVERCORE INC. CLASS A at the time of the generation of this analysis was as follows:
- Chris Zander Named CEO of Evercore Wealth Management; Jeff Maurer Named Chairman
- Evercore Chief Executive Officer Ralph L. Schlosstein to Participate in the Goldman Sachs 2019 U.S. Financial Services Conference on December 10
- Kodiak Sciences to Present at the Evercore ISI HealthCONx Conference
- Danaher To Present At Evercore ISI HealthCONx Conference
- Cyclerion to Present at the Evercore ISI 2nd Annual HealthCONx Conference
About author

Online


Add a comment
Comments
0 comments on the analysis EVERCORE INC. CLASS A - Daily