| Open: | 594.4863 |
| Change: | +1.2646 |
| Volume: | 1,585 |
| Low: | 593.7848 |
| High: | 594.5876 |
| High / Low range: | 0.8028 |
| Type: | Stocks |
| Ticker: | EVR |
| ISIN: |
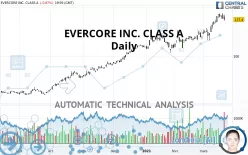
EVERCORE INC. CLASS A - Daily - Technical analysis published on 03/22/2021 (GMT)
- 327
- 0
- 03/22/2021 - 07:05
Click here for a new analysis!
- Timeframe : Daily
- - Analysis generated on 03/22/2021 - 07:05
- Status : LEVEL MAINTAINED

Summary of the analysis

Additional analysis
Quotes
The EVERCORE INC. CLASS A price is 137.40 USD. On the day, this instrument lost -0.87% and was between 136.13 USD and 142.59 USD. This implies that the price is at +0.93% from its lowest and at -3.64% from its highest.A study of price movements over other periods shows the following variations:
New HIGH record (5 years)
Type : Bullish
Timeframe : Weekly
Near a new HIGH record (1 year)
Type : Bullish
Timeframe : Weekly
Near a new HIGH record (1st january)
Type : Bullish
Timeframe : Weekly
Near a new HIGH record (1 month)
Type : Bullish
Timeframe : Weekly
Technical
Technical analysis of EVERCORE INC. CLASS A in Daily shows a strongly overall bullish trend. 92.86% of the signals given by moving averages are bullish. This strongly bullish trend is supported by the strong bullish signals given by short-term moving averages. There is no crossing of moving average by the price or crossing of moving averages between themselves.
The probability of a further increase are moderate given the direction of the technical indicators.
Caution: the Central Indicators scanner currently detects an excess:
CCI indicator is overbought : over 100
Type : Neutral
Timeframe : Daily
CCI indicator: bearish divergence
Type : Bearish
Timeframe : Daily
RSI indicator: bearish divergence
Type : Bearish
Timeframe : Daily
Williams %R indicator is overbought : over -20
Type : Neutral
Timeframe : Daily
Pivot points : price is over resistance 2
Type : Neutral
Timeframe : Daily
Pivot points : price is over resistance 2
Type : Neutral
Timeframe : Weekly
Pivot points : price is under support 1
Type : Neutral
Timeframe : Daily
The analysis of the price chart with Central Patterns scanners does not return any result.
Central Candlesticks, the scanner specialised in Japanese candlesticks, detects a bearish signal that could support the hypothesis of a small drop in the very short term:
Bearish engulfing lines
Type : Bearish
Timeframe : Daily
| S3 | S2 | S1 | Price | R1 | |
|---|---|---|---|---|---|
| ProTrendLines | 98.13 | 106.57 | 114.95 | 137.40 | 142.41 |
| Change (%) | -28.58% | -22.44% | -16.34% | - | +3.65% |
| Change | -39.27 | -30.83 | -22.45 | - | +5.01 |
| Level | Intermediate | Intermediate | Major | - | Major |
To determine price objectives, it is also possible to use the pivot points. Here is the price position in relation to pivot points:
| Pivot points | S3 | S2 | S1 | PP | R1 | R2 | R3 |
|---|---|---|---|---|---|---|---|
| Standard | 128.36 | 132.25 | 134.82 | 138.71 | 141.28 | 145.17 | 147.74 |
| Camarilla | 135.62 | 136.22 | 136.81 | 137.40 | 137.99 | 138.58 | 139.18 |
| Woodie | 127.71 | 131.92 | 134.17 | 138.38 | 140.63 | 144.84 | 147.09 |
| Fibonacci | 132.25 | 134.71 | 136.24 | 138.71 | 141.17 | 142.70 | 145.17 |
| Pivot points | S3 | S2 | S1 | PP | R1 | R2 | R3 |
|---|---|---|---|---|---|---|---|
| Standard | 126.31 | 131.22 | 134.31 | 139.22 | 142.31 | 147.22 | 150.31 |
| Camarilla | 135.20 | 135.93 | 136.67 | 137.40 | 138.13 | 138.87 | 139.60 |
| Woodie | 125.40 | 130.77 | 133.40 | 138.77 | 141.40 | 146.77 | 149.40 |
| Fibonacci | 131.22 | 134.28 | 136.16 | 139.22 | 142.28 | 144.16 | 147.22 |
| Pivot points | S3 | S2 | S1 | PP | R1 | R2 | R3 |
|---|---|---|---|---|---|---|---|
| Standard | 91.33 | 99.50 | 109.63 | 117.80 | 127.93 | 136.10 | 146.23 |
| Camarilla | 114.74 | 116.42 | 118.09 | 119.77 | 121.45 | 123.13 | 124.80 |
| Woodie | 92.32 | 99.99 | 110.62 | 118.29 | 128.92 | 136.59 | 147.22 |
| Fibonacci | 99.50 | 106.49 | 110.81 | 117.80 | 124.79 | 129.11 | 136.10 |
Numerical data
The following are the details of the technical indicators and moving averages that were collected to generate this technical analysis:
| RSI (14): | 64.02 | |
| MACD (12,26,9): | 6.1600 | |
| Directional Movement: | 14.19 | |
| AROON (14): | 64.29 | |
| DEMA (21): | 139.17 | |
| Parabolic SAR (0,02-0,02-0,2): | 135.98 | |
| Elder Ray (13): | 4.66 | |
| Super Trend (3,10): | 126.16 | |
| Zig ZAG (10): | 137.40 | |
| VORTEX (21): | 1.1300 | |
| Stochastique (14,3,5): | 82.41 | |
| TEMA (21): | 141.57 | |
| Williams %R (14): | -24.00 | |
| Chande Momentum Oscillator (20): | 11.54 | |
| Repulse (5,40,3): | -4.6500 | |
| ROCnROLL: | 1 | |
| TRIX (15,9): | 0.6400 | |
| Courbe Coppock: | 28.50 |
| MA7: | 139.53 | |
| MA20: | 129.71 | |
| MA50: | 121.16 | |
| MA100: | 107.70 | |
| MAexp7: | 137.85 | |
| MAexp20: | 131.40 | |
| MAexp50: | 121.68 | |
| MAexp100: | 109.13 | |
| Price / MA7: | -1.53% | |
| Price / MA20: | +5.93% | |
| Price / MA50: | +13.40% | |
| Price / MA100: | +27.58% | |
| Price / MAexp7: | -0.33% | |
| Price / MAexp20: | +4.57% | |
| Price / MAexp50: | +12.92% | |
| Price / MAexp100: | +25.90% |
News
The last news published on EVERCORE INC. CLASS A at the time of the generation of this analysis was as follows:
- 01/20/2020 - 00:00 Evercore Awarded Best M&A Adviser in Singapore for the Fourth Time by The Asset’s Triple A Country Awards 2019
- 01/16/2020 - 13:00 Joe Todd Joins Evercore as Senior Managing Director
- 01/15/2020 - 13:00 Evercore to Announce Fourth Quarter and Full Year 2019
- 01/15/2020 - 13:00 Evercore Wealth Management Appoints Michael Beck Managing Director, Portfolio Manager
- 12/04/2019 - 13:00 Chris Zander Named CEO of Evercore Wealth Management; Jeff Maurer Named Chairman
About author

Online


Add a comment
Comments
0 comments on the analysis EVERCORE INC. CLASS A - Daily