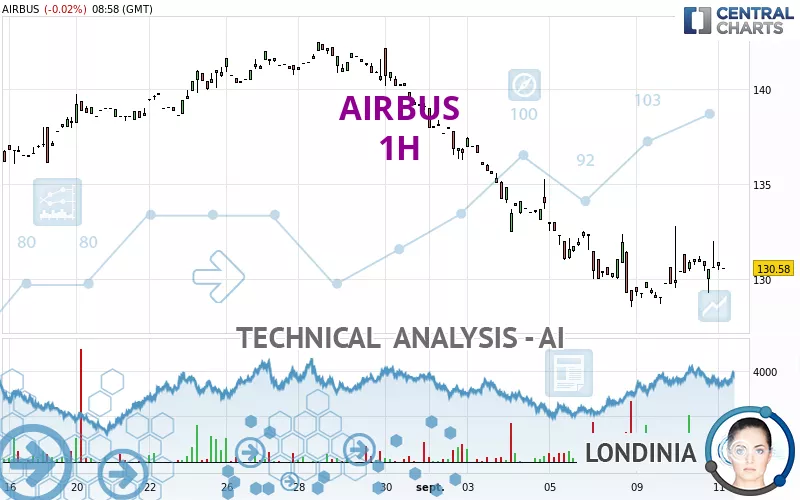
AIRBUS - 1H - Technical analysis published on 09/11/2024 (GMT)
- 148
- 0
Click here for a new analysis!
- Timeframe : 1H
- - Analysis generated on
- Status : TARGET REACHED
Summary of the analysis

Additional analysis
Quotes
AIRBUS rating 130.58 EUR. On the day, this instrument lost -0.02% and was traded between 130.48 EUR and 130.90 EUR over the period. The price is currently at +0.08% from its lowest and -0.24% from its highest.The Central Gaps scanner detects a bullish opening marking the presence of buyers ahead of sellers at the opening but not sufficiently marked to allow the price to register a quotation gap.
Bullish opening
Type : Bullish
Timeframe : Openning
Here is a more detailed summary of the historical variations registered by AIRBUS:
Near a new LOW record (1st january)
Type : Bearish
Timeframe : Weekly
Near a new LOW record (1 month)
Type : Bearish
Timeframe : Weekly
Technical
A technical analysis in 1H of this AIRBUS chart shows a bearish trend. 75.00% of the signals given by moving averages are bearish. Caution: as the signals currently given by short-term moving averages are rather neutral, the bearish trend could slow down. The Central Indicators market scanner is currently detecting a bearish signal that could impact this trend:
Bearish price crossover with adaptative moving average 20
Type : Bearish
Timeframe : 1 hour
An assessment of technical indicators shows a slightly bullish signal.
Central Indicators, the scanner specialised in technical indicators, has identified these signals:
RSI indicator is back under 50
Type : Bearish
Timeframe : 1 hour
Williams %R indicator is back under -50
Type : Bearish
Timeframe : 1 hour
No signals are given by Central Patterns, a market scanner specialised in chart patterns, resistances and supports.
Central Candlesticks, the scanner specialised in Japanese candlesticks, detects this inversion signal that could impact the current short-term trend:
Doji
Type : Neutral
Timeframe : 1 hour
| S3 | S2 | S1 | Price | R1 | R2 | R3 | |
|---|---|---|---|---|---|---|---|
| ProTrendLines | 118.59 | 128.09 | 129.91 | 130.58 | 132.80 | 136.90 | 138.27 |
| Change (%) | -9.18% | -1.91% | -0.51% | - | +1.70% | +4.84% | +5.89% |
| Change | -11.99 | -2.49 | -0.67 | - | +2.22 | +6.32 | +7.69 |
| Level | Minor | Major | Minor | - | Intermediate | Major | Intermediate |
To determine price objectives, it is also possible to use the pivot points. Here is the price position in relation to pivot points:
| Pivot points | S3 | S2 | S1 | PP | R1 | R2 | R3 |
|---|---|---|---|---|---|---|---|
| Standard | 126.47 | 127.85 | 129.23 | 130.61 | 131.99 | 133.37 | 134.75 |
| Camarilla | 129.84 | 130.09 | 130.35 | 130.60 | 130.85 | 131.11 | 131.36 |
| Woodie | 126.46 | 127.85 | 129.22 | 130.61 | 131.98 | 133.37 | 134.74 |
| Fibonacci | 127.85 | 128.91 | 129.56 | 130.61 | 131.67 | 132.32 | 133.37 |
| Pivot points | S3 | S2 | S1 | PP | R1 | R2 | R3 |
|---|---|---|---|---|---|---|---|
| Standard | 114.70 | 121.60 | 125.20 | 132.10 | 135.70 | 142.60 | 146.20 |
| Camarilla | 125.91 | 126.88 | 127.84 | 128.80 | 129.76 | 130.73 | 131.69 |
| Woodie | 113.05 | 120.78 | 123.55 | 131.28 | 134.05 | 141.78 | 144.55 |
| Fibonacci | 121.60 | 125.61 | 128.09 | 132.10 | 136.11 | 138.59 | 142.60 |
| Pivot points | S3 | S2 | S1 | PP | R1 | R2 | R3 |
|---|---|---|---|---|---|---|---|
| Standard | 116.91 | 122.71 | 130.89 | 136.69 | 144.87 | 150.67 | 158.85 |
| Camarilla | 135.22 | 136.50 | 137.78 | 139.06 | 140.34 | 141.62 | 142.91 |
| Woodie | 118.09 | 123.31 | 132.07 | 137.29 | 146.05 | 151.27 | 160.03 |
| Fibonacci | 122.71 | 128.05 | 131.35 | 136.69 | 142.03 | 145.33 | 150.67 |
Numerical data
The following are the details of the technical indicators and moving averages that were collected to generate this technical analysis:
| RSI (14): | 51.06 | |
| MACD (12,26,9): | -0.2300 | |
| Directional Movement: | 13.65 | |
| AROON (14): | 21.42 | |
| DEMA (21): | 130.04 | |
| Parabolic SAR (0,02-0,02-0,2): | 129.21 | |
| Elder Ray (13): | 0.19 | |
| Super Trend (3,10): | 131.17 | |
| Zig ZAG (10): | 130.88 | |
| VORTEX (21): | 0.8700 | |
| Stochastique (14,3,5): | 48.56 | |
| TEMA (21): | 130.78 | |
| Williams %R (14): | -46.15 | |
| Chande Momentum Oscillator (20): | 1.86 | |
| Repulse (5,40,3): | 0.1500 | |
| ROCnROLL: | -1 | |
| TRIX (15,9): | -0.0500 | |
| Courbe Coppock: | 1.90 |
| MA7: | 131.62 | |
| MA20: | 136.54 | |
| MA50: | 134.70 | |
| MA100: | 143.30 | |
| MAexp7: | 130.65 | |
| MAexp20: | 130.54 | |
| MAexp50: | 132.04 | |
| MAexp100: | 134.05 | |
| Price / MA7: | -0.79% | |
| Price / MA20: | -4.37% | |
| Price / MA50: | -3.06% | |
| Price / MA100: | -8.88% | |
| Price / MAexp7: | -0.05% | |
| Price / MAexp20: | +0.03% | |
| Price / MAexp50: | -1.11% | |
| Price / MAexp100: | -2.59% |
About author
Online


Add a comment
Comments
0 comments on the analysis AIRBUS - 1H