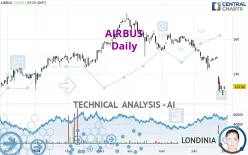
AIRBUS - Daily - Technical analysis published on 07/01/2024 (GMT)
- 235
- 0
Click here for a new analysis!
- Timeframe : Daily
- - Analysis generated on
- Status : LEVEL MAINTAINED

Summary of the analysis

Additional analysis
Quotes
The AIRBUS price is 132.66 EUR. The price has increased by +3.72% since the last closing and was between 131.10 EUR and 132.66 EUR. This implies that the price is at +1.19% from its lowest and at 0% from its highest.The Central Gaps scanner detects a bullish gap which is a sign that buyers have taken the lead in the very short term.
Opening Gap UP
Type : Bullish
Timeframe : Openning
A study of price movements over other periods shows the following variations:
New LOW record (1st january)
Type : Bearish
Timeframe : Weekly
New LOW record (1 month)
Type : Bearish
Timeframe : Weekly
Abnormal volumes on AIRBUS were detected by the Central Volumes scanner:
Abnormal volumes
Timeframe : 5 days
Technical
A technical analysis in Daily of this AIRBUS chart shows a sharp bearish trend. 92.86% of the signals given by moving averages are bearish. This strongly bearish trend is supported by the strong bearish signals given by short-term moving averages. The Central Indicators market scanner currently does not detect any result that concerns moving averages.
An assessment of technical indicators does not currently provide any relevant information to suggest whether the signal given by the technical indicators is more bullish or bearish.
But beware of excesses. The Central Indicators scanner currently detects this:
CCI indicator is oversold : under -100
Type : Neutral
Timeframe : Daily
Previous candle closed under Bollinger bands
Type : Neutral
Timeframe : Daily
Williams %R indicator is oversold : under -80
Type : Neutral
Timeframe : Daily
Pivot points : price is over resistance 3
Type : Neutral
Timeframe : Daily
Pivot points : price is under support 3
Type : Neutral
Timeframe : Weekly
An analysis of the price chart with the Central Patterns scanner (detector of chart patterns and resistances and supports) shows a result that can have an impact on the price change:
Near support of channel
Type : Bullish
Timeframe : Daily
The Central Candlesticks scanner, specialised in Japanese candlesticks, did not identify any signals.
| S3 | S2 | S1 | Price | R1 | R2 | R3 | |
|---|---|---|---|---|---|---|---|
| ProTrendLines | 108.71 | 121.52 | 126.38 | 132.66 | 136.82 | 143.88 | 152.10 |
| Change (%) | -18.05% | -8.40% | -4.73% | - | +3.14% | +8.46% | +14.65% |
| Change | -23.95 | -11.14 | -6.28 | - | +4.16 | +11.22 | +19.44 |
| Level | Minor | Major | Minor | - | Major | Major | Minor |
Pivot points can also be used to set your price objectives. Here is the price situation in relation to pivot points:
| Pivot points | S3 | S2 | S1 | PP | R1 | R2 | R3 |
|---|---|---|---|---|---|---|---|
| Standard | 124.13 | 125.91 | 126.91 | 128.69 | 129.69 | 131.47 | 132.47 |
| Camarilla | 127.14 | 127.39 | 127.65 | 127.90 | 128.16 | 128.41 | 128.67 |
| Woodie | 123.73 | 125.72 | 126.51 | 128.50 | 129.29 | 131.28 | 132.07 |
| Fibonacci | 125.91 | 126.98 | 127.63 | 128.69 | 129.76 | 130.41 | 131.47 |
| Pivot points | S3 | S2 | S1 | PP | R1 | R2 | R3 |
|---|---|---|---|---|---|---|---|
| Standard | 98.37 | 113.03 | 120.47 | 135.13 | 142.57 | 157.23 | 164.67 |
| Camarilla | 121.82 | 123.85 | 125.87 | 127.90 | 129.93 | 131.95 | 133.98 |
| Woodie | 94.75 | 111.23 | 116.85 | 133.33 | 138.95 | 155.43 | 161.05 |
| Fibonacci | 113.03 | 121.48 | 126.69 | 135.13 | 143.58 | 148.79 | 157.23 |
| Pivot points | S3 | S2 | S1 | PP | R1 | R2 | R3 |
|---|---|---|---|---|---|---|---|
| Standard | 88.05 | 107.87 | 117.89 | 137.71 | 147.73 | 167.55 | 177.57 |
| Camarilla | 119.69 | 122.43 | 125.17 | 127.90 | 130.64 | 133.37 | 136.11 |
| Woodie | 83.14 | 105.42 | 112.98 | 135.26 | 142.82 | 165.10 | 172.66 |
| Fibonacci | 107.87 | 119.27 | 126.31 | 137.71 | 149.11 | 156.15 | 167.55 |
Numerical data
The following is the status of technical indicators and moving averages registered at the time this technical analysis was created:
| RSI (14): | 26.54 | |
| MACD (12,26,9): | -6.4000 | |
| Directional Movement: | -32.31 | |
| AROON (14): | -92.86 | |
| DEMA (21): | 135.23 | |
| Parabolic SAR (0,02-0,02-0,2): | 146.97 | |
| Elder Ray (13): | -7.95 | |
| Super Trend (3,10): | 142.51 | |
| Zig ZAG (10): | 132.16 | |
| VORTEX (21): | 0.7400 | |
| Stochastique (14,3,5): | 9.73 | |
| TEMA (21): | 131.71 | |
| Williams %R (14): | -80.35 | |
| Chande Momentum Oscillator (20): | -13.84 | |
| Repulse (5,40,3): | -3.3000 | |
| ROCnROLL: | 2 | |
| TRIX (15,9): | -0.4400 | |
| Courbe Coppock: | 19.19 |
| MA7: | 136.33 | |
| MA20: | 144.38 | |
| MA50: | 152.96 | |
| MA100: | 155.80 | |
| MAexp7: | 135.07 | |
| MAexp20: | 142.84 | |
| MAexp50: | 149.99 | |
| MAexp100: | 151.45 | |
| Price / MA7: | -2.69% | |
| Price / MA20: | -8.12% | |
| Price / MA50: | -13.27% | |
| Price / MA100: | -14.85% | |
| Price / MAexp7: | -1.78% | |
| Price / MAexp20: | -7.13% | |
| Price / MAexp50: | -11.55% | |
| Price / MAexp100: | -12.41% |
About author
Online


Add a comment
Comments
0 comments on the analysis AIRBUS - Daily