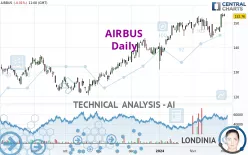
AIRBUS - Daily - Technical analysis published on 03/01/2024 (GMT)
- 136
- 0
Click here for a new analysis!
- Timeframe : Daily
- - Analysis generated on
- Status : TARGET REACHED

Summary of the analysis

Additional analysis
Quotes
AIRBUS rating 152.76 EUR. On the day, this instrument lost -0.01% and was traded between 152.74 EUR and 153.80 EUR over the period. The price is currently at +0.01% from its lowest and -0.68% from its highest.The Central Gaps scanner detects a bullish opening marking the presence of buyers ahead of sellers at the opening but not sufficiently marked to allow the price to register a quotation gap.
Bullish opening
Type : Bullish
Timeframe : Openning
A study of price movements over other periods shows the following variations:
New HIGH record (5 years)
Type : Bullish
Timeframe : Weekly
Near a new HIGH record (1 year)
Type : Bullish
Timeframe : Weekly
Near a new HIGH record (1st january)
Type : Bullish
Timeframe : Weekly
Near a new HIGH record (1 month)
Type : Bullish
Timeframe : Weekly
The Central Volumes scanner notes the presence of abnormal volumes:
Abnormal volumes
Timeframe : 20 days
Abnormal volumes
Timeframe : 50 days
Technical
Technical analysis of this Daily chart of AIRBUS indicates that the overall trend is strongly bullish. 92.86% of the signals given by moving averages are bullish. This strongly bullish trend is supported by the strong bullish signals given by short-term moving averages. The Central Indicators market scanner currently does not detect any result that concerns moving averages.
An assessment of technical indicators shows a moderate bullish signal.
Caution: the Central Indicators scanner currently detects an excess:
CCI indicator is overbought : over 100
Type : Neutral
Timeframe : Daily
CCI indicator: bearish divergence
Type : Bearish
Timeframe : Daily
Williams %R indicator is overbought : over -20
Type : Neutral
Timeframe : Daily
Pivot points : price is over resistance 2
Type : Neutral
Timeframe : Weekly
Price is back under the pivot point
Type : Bearish
Timeframe : Daily
An analysis of the price chart with the Central Patterns scanner (detector of chart patterns and resistances and supports) shows a result that can have an impact on the price change:
Near horizontal support
Type : Bullish
Timeframe : Daily
The Central Candlesticks scanner, specialised in Japanese candlesticks, did not identify any signals.
| S3 | S2 | S1 | Price | |
|---|---|---|---|---|
| ProTrendLines | 136.82 | 144.12 | 152.04 | 152.76 |
| Change (%) | -10.43% | -5.66% | -0.47% | - |
| Change | -15.94 | -8.64 | -0.72 | - |
| Level | Major | Intermediate | Intermediate | - |
To determine price objectives, it is also possible to use the pivot points. Here is the price position in relation to pivot points:
| Pivot points | S3 | S2 | S1 | PP | R1 | R2 | R3 |
|---|---|---|---|---|---|---|---|
| Standard | 150.25 | 151.25 | 152.01 | 153.01 | 153.77 | 154.77 | 155.53 |
| Camarilla | 152.30 | 152.46 | 152.62 | 152.78 | 152.94 | 153.10 | 153.26 |
| Woodie | 150.14 | 151.19 | 151.90 | 152.95 | 153.66 | 154.71 | 155.42 |
| Fibonacci | 151.25 | 151.92 | 152.33 | 153.01 | 153.68 | 154.09 | 154.77 |
| Pivot points | S3 | S2 | S1 | PP | R1 | R2 | R3 |
|---|---|---|---|---|---|---|---|
| Standard | 139.31 | 141.65 | 144.85 | 147.19 | 150.39 | 152.73 | 155.93 |
| Camarilla | 146.54 | 147.04 | 147.55 | 148.06 | 148.57 | 149.08 | 149.58 |
| Woodie | 139.75 | 141.87 | 145.29 | 147.41 | 150.83 | 152.95 | 156.37 |
| Fibonacci | 141.65 | 143.76 | 145.07 | 147.19 | 149.30 | 150.61 | 152.73 |
| Pivot points | S3 | S2 | S1 | PP | R1 | R2 | R3 |
|---|---|---|---|---|---|---|---|
| Standard | 136.49 | 140.23 | 146.51 | 150.25 | 156.53 | 160.27 | 166.55 |
| Camarilla | 150.03 | 150.94 | 151.86 | 152.78 | 153.70 | 154.62 | 155.54 |
| Woodie | 137.75 | 140.87 | 147.77 | 150.89 | 157.79 | 160.91 | 167.81 |
| Fibonacci | 140.23 | 144.06 | 146.43 | 150.25 | 154.08 | 156.45 | 160.27 |
Numerical data
The following is the status of the technical indicators and moving averages at the time of publication of this technical analysis:
| RSI (14): | 62.11 | |
| MACD (12,26,9): | 1.1800 | |
| Directional Movement: | 11.22 | |
| AROON (14): | 57.15 | |
| DEMA (21): | 150.49 | |
| Parabolic SAR (0,02-0,02-0,2): | 144.56 | |
| Elder Ray (13): | 3.68 | |
| Super Trend (3,10): | 145.46 | |
| Zig ZAG (10): | 152.74 | |
| VORTEX (21): | 1.0700 | |
| Stochastique (14,3,5): | 91.54 | |
| TEMA (21): | 150.28 | |
| Williams %R (14): | -12.57 | |
| Chande Momentum Oscillator (20): | 2.20 | |
| Repulse (5,40,3): | 1.2800 | |
| ROCnROLL: | 1 | |
| TRIX (15,9): | 0.0600 | |
| Courbe Coppock: | 0.22 |
| MA7: | 150.02 | |
| MA20: | 149.06 | |
| MA50: | 146.45 | |
| MA100: | 139.05 | |
| MAexp7: | 150.62 | |
| MAexp20: | 149.00 | |
| MAexp50: | 146.08 | |
| MAexp100: | 141.44 | |
| Price / MA7: | +1.83% | |
| Price / MA20: | +2.48% | |
| Price / MA50: | +4.31% | |
| Price / MA100: | +9.86% | |
| Price / MAexp7: | +1.42% | |
| Price / MAexp20: | +2.52% | |
| Price / MAexp50: | +4.57% | |
| Price / MAexp100: | +8.00% |
About author
Online


Add a comment
Comments
0 comments on the analysis AIRBUS - Daily