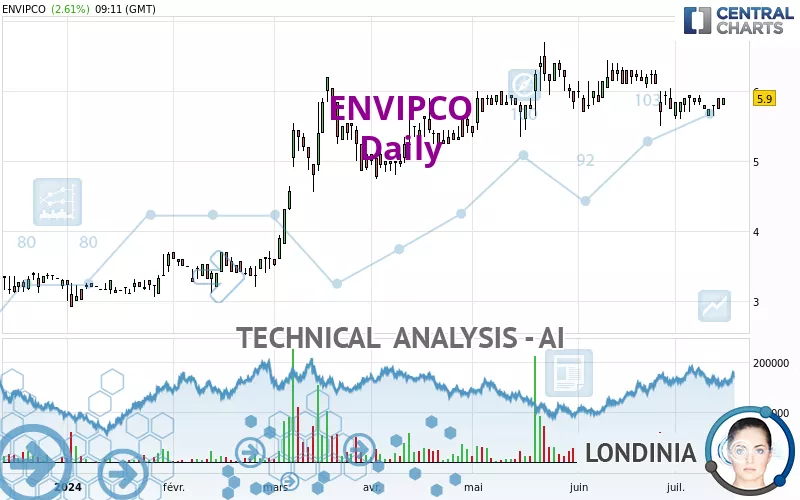
ENVIPCO - Daily - Technical analysis published on 07/15/2024 (GMT)
- 142
- 0
Click here for a new analysis!
- Timeframe : Daily
- - Analysis generated on
- Status : INVALID

Summary of the analysis

Additional analysis
Quotes
The ENVIPCO price is 5.90 EUR. The price registered an increase of +2.61% on the session and was between 5.80 EUR and 5.90 EUR. This implies that the price is at +1.72% from its lowest and at 0% from its highest.So that you have an overall view of the price change, here is a table showing the variations over several periods:
Technical
Technical analysis of this Daily chart of ENVIPCO indicates that the overall trend is bullish. 75.00% of the signals given by moving averages are bullish. Caution: the neutral signals currently given by the short-term moving averages indicate that this bullish trend is showing signs of running out of steam. The Central Indicators market scanner is currently detecting several bullish signals that could impact this trend:
Bullish price crossover with adaptative moving average 20
Type : Bullish
Timeframe : Daily
Bullish price crossover with adaptative moving average 100
Type : Bullish
Timeframe : Daily
An assessment of technical indicators shows a slightly bullish signal.
Central Indicators, the scanner specialised in technical indicators, has identified these signals:
Pivot points : price is over resistance 1
Type : Neutral
Timeframe : Daily
Momentum indicator is back under 0
Type : Bearish
Timeframe : Daily
Williams %R indicator is back over -50
Type : Bullish
Timeframe : Daily
The Central Patterns scanner, which studies chart patterns, resistances and supports, has identified this signal:
Near resistance of triangle
Type : Bearish
Timeframe : Daily
The Central Candlesticks scanner which studies Japanese candlesticks did not detect anything.
| S3 | S2 | S1 | Price | R1 | |
|---|---|---|---|---|---|
| ProTrendLines | 3.45 | 4.78 | 5.70 | 5.90 | 6.40 |
| Change (%) | -41.53% | -18.98% | -3.39% | - | +8.47% |
| Change | -2.45 | -1.12 | -0.20 | - | +0.50 |
| Level | Major | Minor | Intermediate | - | Intermediate |
To determine price objectives, it is also possible to use the pivot points. Here is the price position in relation to pivot points:
| Pivot points | S3 | S2 | S1 | PP | R1 | R2 | R3 |
|---|---|---|---|---|---|---|---|
| Standard | 5.55 | 5.65 | 5.70 | 5.80 | 5.85 | 5.95 | 6.00 |
| Camarilla | 5.71 | 5.72 | 5.74 | 5.75 | 5.76 | 5.78 | 5.79 |
| Woodie | 5.53 | 5.64 | 5.68 | 5.79 | 5.83 | 5.94 | 5.98 |
| Fibonacci | 5.65 | 5.71 | 5.74 | 5.80 | 5.86 | 5.89 | 5.95 |
| Pivot points | S3 | S2 | S1 | PP | R1 | R2 | R3 |
|---|---|---|---|---|---|---|---|
| Standard | 5.32 | 5.48 | 5.62 | 5.78 | 5.92 | 6.08 | 6.22 |
| Camarilla | 5.67 | 5.70 | 5.72 | 5.75 | 5.78 | 5.81 | 5.83 |
| Woodie | 5.30 | 5.48 | 5.60 | 5.78 | 5.90 | 6.08 | 6.20 |
| Fibonacci | 5.48 | 5.60 | 5.67 | 5.78 | 5.90 | 5.97 | 6.08 |
| Pivot points | S3 | S2 | S1 | PP | R1 | R2 | R3 |
|---|---|---|---|---|---|---|---|
| Standard | 4.40 | 4.95 | 5.35 | 5.90 | 6.30 | 6.85 | 7.25 |
| Camarilla | 5.49 | 5.58 | 5.66 | 5.75 | 5.84 | 5.92 | 6.01 |
| Woodie | 4.33 | 4.91 | 5.28 | 5.86 | 6.23 | 6.81 | 7.18 |
| Fibonacci | 4.95 | 5.31 | 5.54 | 5.90 | 6.26 | 6.49 | 6.85 |
Numerical data
The following are the details of the technical indicators and moving averages that were collected to generate this technical analysis:
| RSI (14): | 49.82 | |
| MACD (12,26,9): | -0.0500 | |
| Directional Movement: | -2.86 | |
| AROON (14): | -7.14 | |
| DEMA (21): | 5.84 | |
| Parabolic SAR (0,02-0,02-0,2): | 5.90 | |
| Elder Ray (13): | -0.01 | |
| Super Trend (3,10): | 5.48 | |
| Zig ZAG (10): | 5.90 | |
| VORTEX (21): | 0.9100 | |
| Stochastique (14,3,5): | 47.16 | |
| TEMA (21): | 5.75 | |
| Williams %R (14): | -27.27 | |
| Chande Momentum Oscillator (20): | -0.05 | |
| Repulse (5,40,3): | 1.4900 | |
| ROCnROLL: | 1 | |
| TRIX (15,9): | -0.1000 | |
| Courbe Coppock: | 8.46 |
| MA7: | 5.81 | |
| MA20: | 5.94 | |
| MA50: | 5.98 | |
| MA100: | 5.49 | |
| MAexp7: | 5.83 | |
| MAexp20: | 5.89 | |
| MAexp50: | 5.82 | |
| MAexp100: | 5.37 | |
| Price / MA7: | +1.55% | |
| Price / MA20: | -0.67% | |
| Price / MA50: | -1.34% | |
| Price / MA100: | +7.47% | |
| Price / MAexp7: | +1.20% | |
| Price / MAexp20: | +0.17% | |
| Price / MAexp50: | +1.37% | |
| Price / MAexp100: | +9.87% |
About author
Online


Add a comment
Comments
0 comments on the analysis ENVIPCO - Daily