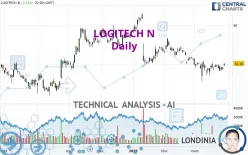
LOGITECH N - Daily - Technical analysis published on 03/29/2023 (GMT)
- 198
- 0
Click here for a new analysis!
- Timeframe : Daily
- - Analysis generated on
- Status : INVALID

Summary of the analysis

Additional analysis
Quotes
The LOGITECH N rating is 50.1800 CHF. The price has increased by +2.74% since the last closing and was between 49.6500 CHF and 50.1800 CHF. This implies that the price is at +1.07% from its lowest and at 0% from its highest.The Central Gaps scanner detects the formation of a bullish gap marking the strong presence of buyers against sellers at the opening. This formed a quotation gap.
Opening Gap UP
Type : Bullish
Timeframe : Openning
Here is a more detailed summary of the historical variations registered by LOGITECH N:
Near a new HIGH record (1 month)
Type : Bullish
Timeframe : Weekly
Technical
Technical analysis of LOGITECH N in Daily shows an overall bearish trend. 75.00% of the signals given by moving averages are bearish. Caution: the neutral signals currently given by short-term moving averages show us that the global trend is losing momentum. The Central Indicators scanner detects a bullish signal on moving averages that could impact this trend:
Bullish price crossover with Moving Average 20
Type : Bullish
Timeframe : Daily
In fact, 10 technical indicators on 18 studied are currently positioned bullish. Caution: the Central Indicators scanner currently detects an excess:
Williams %R indicator is overbought : over -20
Type : Neutral
Timeframe : Daily
Pivot points : price is over resistance 1
Type : Neutral
Timeframe : Weekly
Pivot points : price is over resistance 2
Type : Neutral
Timeframe : Daily
Aroon indicator bearish trend
Type : Bearish
Timeframe : Daily
Ichimoku - Bullish crossover : Tenkan & Kijun
Type : Bullish
Timeframe : Daily
Momentum indicator is back over 0
Type : Bullish
Timeframe : Daily
An analysis of the price chart with the Central Patterns scanner (detector of chart patterns and resistances and supports) shows a result that can have an impact on the price change:
Near resistance of channel
Type : Bearish
Timeframe : Daily
The Central Candlesticks scanner, specialised in Japanese candlesticks, did not identify any signals.
| S3 | S2 | S1 | Price | R1 | R2 | R3 | |
|---|---|---|---|---|---|---|---|
| ProTrendLines | 32.6673 | 43.1600 | 48.6500 | 50.1800 | 50.4789 | 56.2400 | 59.1200 |
| Change (%) | -34.90% | -13.99% | -3.05% | - | +0.60% | +12.08% | +17.82% |
| Change | -17.5127 | -7.0200 | -1.5300 | - | +0.2989 | +6.0600 | +8.9400 |
| Level | Major | Intermediate | Major | - | Major | Minor | Intermediate |
Pivot points can also be used to set your price objectives. Here is the price situation in relation to pivot points:
| Pivot points | S3 | S2 | S1 | PP | R1 | R2 | R3 |
|---|---|---|---|---|---|---|---|
| Standard | 47.7767 | 48.1933 | 48.5167 | 48.9333 | 49.2567 | 49.6733 | 49.9967 |
| Camarilla | 48.6365 | 48.7043 | 48.7722 | 48.8400 | 48.9078 | 48.9757 | 49.0435 |
| Woodie | 47.7300 | 48.1700 | 48.4700 | 48.9100 | 49.2100 | 49.6500 | 49.9500 |
| Fibonacci | 48.1933 | 48.4760 | 48.6507 | 48.9333 | 49.2160 | 49.3907 | 49.6733 |
| Pivot points | S3 | S2 | S1 | PP | R1 | R2 | R3 |
|---|---|---|---|---|---|---|---|
| Standard | 45.9867 | 47.1133 | 47.7367 | 48.8633 | 49.4867 | 50.6133 | 51.2367 |
| Camarilla | 47.8788 | 48.0392 | 48.1996 | 48.3600 | 48.5204 | 48.6808 | 48.8413 |
| Woodie | 45.7350 | 46.9875 | 47.4850 | 48.7375 | 49.2350 | 50.4875 | 50.9850 |
| Fibonacci | 47.1133 | 47.7818 | 48.1948 | 48.8633 | 49.5318 | 49.9448 | 50.6133 |
| Pivot points | S3 | S2 | S1 | PP | R1 | R2 | R3 |
|---|---|---|---|---|---|---|---|
| Standard | 42.2467 | 46.1333 | 48.8067 | 52.6933 | 55.3667 | 59.2533 | 61.9267 |
| Camarilla | 49.6760 | 50.2773 | 50.8787 | 51.4800 | 52.0813 | 52.6827 | 53.2840 |
| Woodie | 41.6400 | 45.8300 | 48.2000 | 52.3900 | 54.7600 | 58.9500 | 61.3200 |
| Fibonacci | 46.1333 | 48.6393 | 50.1874 | 52.6933 | 55.1993 | 56.7474 | 59.2533 |
Numerical data
The following are the details of the technical indicators and moving averages that were collected to generate this technical analysis:
| RSI (14): | 48.89 | |
| MACD (12,26,9): | -0.7190 | |
| Directional Movement: | -11.2040 | |
| AROON (14): | -28.5714 | |
| DEMA (21): | 48.5820 | |
| Parabolic SAR (0,02-0,02-0,2): | 46.9736 | |
| Elder Ray (13): | 0.5650 | |
| Super Trend (3,10): | 52.4784 | |
| Zig ZAG (10): | 49.8700 | |
| VORTEX (21): | 0.8661 | |
| Stochastique (14,3,5): | 62.90 | |
| TEMA (21): | 48.7665 | |
| Williams %R (14): | -16.42 | |
| Chande Momentum Oscillator (20): | 1.5100 | |
| Repulse (5,40,3): | -1.3484 | |
| ROCnROLL: | -1 | |
| TRIX (15,9): | -0.2648 | |
| Courbe Coppock: | 2.36 |
| MA7: | 49.1929 | |
| MA20: | 49.3250 | |
| MA50: | 51.4908 | |
| MA100: | 54.0508 | |
| MAexp7: | 49.1907 | |
| MAexp20: | 49.6582 | |
| MAexp50: | 51.1809 | |
| MAexp100: | 52.2495 | |
| Price / MA7: | +2.01% | |
| Price / MA20: | +1.73% | |
| Price / MA50: | -2.55% | |
| Price / MA100: | -7.16% | |
| Price / MAexp7: | +2.01% | |
| Price / MAexp20: | +1.05% | |
| Price / MAexp50: | -1.96% | |
| Price / MAexp100: | -3.96% |
News
Don't forget to follow the news on LOGITECH N. At the time of publication of this analysis, the latest news was as follows:
- Logitech Recognized for Addressing Climate Change within the Supply Chain
- Introducing Logitech Zone Learn, Wired Headsets Built for Sustained Focus and Long-Term Use
- Pensole Lewis College and Logitech Collaborate to Revolutionize the Next Generation of Design
- Logitech Hosts Annual Analyst and Investor Day
- Logitech To Participate in Upcoming Investor Conference
About author
Online


Add a comment
Comments
0 comments on the analysis LOGITECH N - Daily