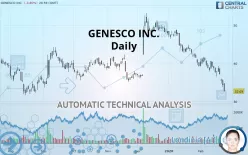
GENESCO INC. - Daily - Technical analysis published on 02/27/2020 (GMT)
- 325
- 0
- Who voted?
Click here for a new analysis!
- Timeframe : Daily
- - Analysis generated on
- Status : TARGET REACHED

Summary of the analysis

Additional analysis
Quotes
The GENESCO INC. rating is 32.69 USD. The price registered a decrease of -4.81% on the session and was traded between 32.60 USD and 34.83 USD over the period. The price is currently at +0.28% from its lowest and -6.14% from its highest.A bullish opening was detected by the Central Gaps scanner. Buyers are trying to impose a bullish momentum in the very short term.
Bullish opening
Type : Bullish
Timeframe : Openning
So that you have an overall view of the price change, here is a table showing the variations over several periods:
Near a new LOW record (1 year)
Type : Bearish
Timeframe : Weekly
Technical
Technical analysis of GENESCO INC. in Daily shows a overall strongly bearish trend. The signals given by moving averages are 89.29% bearish. This strong bearish trend is confirmed by the strong signals currently being given by short-term moving averages. An assessment of moving averages reveals a bearish signal that could impact this trend:
Moving Average bearish crossovers : AMA50 & AMA100
Type : Bearish
Timeframe : Daily
The probability of a further decline is high given the direction of the technical indicators.
But beware of excesses. The Central Indicators scanner currently detects this:
RSI indicator is oversold : under 30
Type : Neutral
Timeframe : Daily
CCI indicator is oversold : under -100
Type : Neutral
Timeframe : Daily
Williams %R indicator is oversold : under -80
Type : Neutral
Timeframe : Daily
Pivot points : price is under support 1
Type : Neutral
Timeframe : Daily
Pivot points : price is under support 3
Type : Neutral
Timeframe : Weekly
No signals are given by Central Patterns, a market scanner specialised in chart patterns, resistances and supports.
No result was found by the Central Candlesticks scanner on Japanese candlesticks.
| S3 | S2 | S1 | Price | R1 | R2 | R3 | |
|---|---|---|---|---|---|---|---|
| ProTrendLines | 21.15 | 25.92 | 32.24 | 32.69 | 35.59 | 41.31 | 43.47 |
| Change (%) | -35.30% | -20.71% | -1.38% | - | +8.87% | +26.37% | +32.98% |
| Change | -11.54 | -6.77 | -0.45 | - | +2.90 | +8.62 | +10.78 |
| Level | Minor | Major | Major | - | Minor | Major | Intermediate |
Pivot points can also be used to set your price objectives. Here is the price situation in relation to pivot points:
| Pivot points | S3 | S2 | S1 | PP | R1 | R2 | R3 |
|---|---|---|---|---|---|---|---|
| Standard | 31.47 | 32.63 | 33.49 | 34.65 | 35.51 | 36.67 | 37.53 |
| Camarilla | 33.79 | 33.97 | 34.16 | 34.34 | 34.53 | 34.71 | 34.90 |
| Woodie | 31.31 | 32.56 | 33.33 | 34.58 | 35.35 | 36.60 | 37.37 |
| Fibonacci | 32.63 | 33.41 | 33.88 | 34.65 | 35.43 | 35.90 | 36.67 |
| Pivot points | S3 | S2 | S1 | PP | R1 | R2 | R3 |
|---|---|---|---|---|---|---|---|
| Standard | 33.19 | 34.84 | 36.02 | 37.67 | 38.85 | 40.50 | 41.68 |
| Camarilla | 36.42 | 36.68 | 36.94 | 37.20 | 37.46 | 37.72 | 37.98 |
| Woodie | 32.96 | 34.72 | 35.79 | 37.55 | 38.62 | 40.38 | 41.45 |
| Fibonacci | 34.84 | 35.92 | 36.59 | 37.67 | 38.75 | 39.42 | 40.50 |
| Pivot points | S3 | S2 | S1 | PP | R1 | R2 | R3 |
|---|---|---|---|---|---|---|---|
| Standard | 26.32 | 32.73 | 36.03 | 42.44 | 45.74 | 52.15 | 55.45 |
| Camarilla | 36.65 | 37.54 | 38.43 | 39.32 | 40.21 | 41.10 | 41.99 |
| Woodie | 24.76 | 31.95 | 34.47 | 41.66 | 44.18 | 51.37 | 53.89 |
| Fibonacci | 32.73 | 36.44 | 38.73 | 42.44 | 46.15 | 48.44 | 52.15 |
Numerical data
The following is the status of the technical indicators and moving averages at the time of publication of this technical analysis:
| RSI (14): | 25.07 | |
| MACD (12,26,9): | -2.2400 | |
| Directional Movement: | -27.53 | |
| AROON (14): | -100.00 | |
| DEMA (21): | 35.69 | |
| Parabolic SAR (0,02-0,02-0,2): | 38.16 | |
| Elder Ray (13): | -3.54 | |
| Super Trend (3,10): | 38.81 | |
| Zig ZAG (10): | 32.69 | |
| VORTEX (21): | 0.7400 | |
| Stochastique (14,3,5): | 6.16 | |
| TEMA (21): | 34.50 | |
| Williams %R (14): | -98.99 | |
| Chande Momentum Oscillator (20): | -6.96 | |
| Repulse (5,40,3): | -12.0400 | |
| ROCnROLL: | 2 | |
| TRIX (15,9): | -0.6400 | |
| Courbe Coppock: | 21.44 |
| MA7: | 36.30 | |
| MA20: | 38.66 | |
| MA50: | 43.47 | |
| MA100: | 41.64 | |
| MAexp7: | 35.79 | |
| MAexp20: | 38.47 | |
| MAexp50: | 40.92 | |
| MAexp100: | 41.45 | |
| Price / MA7: | -9.94% | |
| Price / MA20: | -15.44% | |
| Price / MA50: | -24.80% | |
| Price / MA100: | -21.49% | |
| Price / MAexp7: | -8.66% | |
| Price / MAexp20: | -15.02% | |
| Price / MAexp50: | -20.11% | |
| Price / MAexp100: | -21.13% |
News
The latest news and videos published on GENESCO INC. at the time of the analysis were as follows:
- Genesco Announces New Corporate Headquarters
- Genesco Inc. Earns Top Marks in 2020 Corporate Equality Index
- Genesco Reports Comparable Sales
- Genesco Closes Acquisition Of Leading Footwear Licensee Togast And Enters Into New Levi's Footwear License Agreement
- Genesco to Acquire Leading Footwear Licensee Togast and to Enter into a Levi's Footwear License Agreement
About author

Online


Add a comment
Comments
0 comments on the analysis GENESCO INC. - Daily