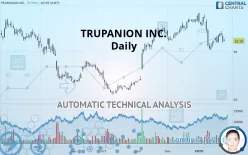
TRUPANION INC. - Daily - Technical analysis published on 01/29/2020 (GMT)
- 372
- 0
Click here for a new analysis!
- Timeframe : Daily
- - Analysis generated on
- Status : INVALID

Summary of the analysis

Additional analysis
Quotes
The TRUPANION INC. price is 32.19 USD. The price registered a decrease of +0.59% on the session and was between 32.05 USD and 32.74 USD. This implies that the price is at +0.44% from its lowest and at -1.68% from its highest.A bullish opening was detected by the Central Gaps scanner. Buyers are trying to impose a bullish momentum in the very short term.
Bullish opening
Type : Bullish
Timeframe : Openning
So that you have an overall view of the price change, here is a table showing the variations over several periods:
Technical
Technical analysis of TRUPANION INC. in Daily shows an overall slightly bullish trend. 53.57% of the signals given by moving averages are bullish. Caution: a reversal of the trend could be possible given the strong bearish signals of short-term moving averages. An assessment of moving averages reveals several bearish signals that could impact this trend:
Bearish trend reversal : adaptative moving average 50
Type : Bearish
Timeframe : Daily
Moving Average bearish crossovers : MA20 & MA50
Type : Bearish
Timeframe : Daily
On the 18 technical indicators analysed, 5 are bullish, 4 are neutral and 9 are bearish. Central Indicators, the scanner specialised in technical indicators, has identified these signals:
Pivot points : price is under support 1
Type : Neutral
Timeframe : Weekly
RSI indicator is back under 50
Type : Bearish
Timeframe : Daily
Price is back over the pivot point
Type : Bullish
Timeframe : Weekly
Price is back under the pivot point
Type : Bearish
Timeframe : Daily
The analysis of the price chart with Central Patterns scanners does not return any result.
The Central Candlesticks scanner, specialised in Japanese candlesticks, did not identify any signals.
| S3 | S2 | S1 | Price | R1 | R2 | R3 | |
|---|---|---|---|---|---|---|---|
| ProTrendLines | 26.00 | 27.86 | 30.65 | 32.19 | 32.68 | 34.12 | 36.76 |
| Change (%) | -19.23% | -13.45% | -4.78% | - | +1.52% | +6.00% | +14.20% |
| Change | -6.19 | -4.33 | -1.54 | - | +0.49 | +1.93 | +4.57 |
| Level | Intermediate | Minor | Major | - | Major | Intermediate | Major |
To determine price objectives, it is also possible to use the pivot points. Here is the price position in relation to pivot points:
| Pivot points | S3 | S2 | S1 | PP | R1 | R2 | R3 |
|---|---|---|---|---|---|---|---|
| Standard | 29.53 | 30.72 | 31.36 | 32.55 | 33.19 | 34.38 | 35.02 |
| Camarilla | 31.50 | 31.66 | 31.83 | 32.00 | 32.17 | 32.34 | 32.50 |
| Woodie | 29.26 | 30.58 | 31.09 | 32.41 | 32.92 | 34.24 | 34.75 |
| Fibonacci | 30.72 | 31.42 | 31.85 | 32.55 | 33.25 | 33.68 | 34.38 |
| Pivot points | S3 | S2 | S1 | PP | R1 | R2 | R3 |
|---|---|---|---|---|---|---|---|
| Standard | 29.80 | 30.80 | 32.31 | 33.31 | 34.82 | 35.82 | 37.33 |
| Camarilla | 33.13 | 33.36 | 33.59 | 33.82 | 34.05 | 34.28 | 34.51 |
| Woodie | 30.06 | 30.93 | 32.57 | 33.44 | 35.08 | 35.95 | 37.59 |
| Fibonacci | 30.80 | 31.76 | 32.35 | 33.31 | 34.27 | 34.86 | 35.82 |
| Pivot points | S3 | S2 | S1 | PP | R1 | R2 | R3 |
|---|---|---|---|---|---|---|---|
| Standard | 28.03 | 30.06 | 33.76 | 35.79 | 39.49 | 41.52 | 45.22 |
| Camarilla | 35.88 | 36.41 | 36.94 | 37.46 | 37.99 | 38.51 | 39.04 |
| Woodie | 28.87 | 30.48 | 34.60 | 36.21 | 40.33 | 41.94 | 46.06 |
| Fibonacci | 30.06 | 32.25 | 33.60 | 35.79 | 37.98 | 39.33 | 41.52 |
Numerical data
The following is the status of technical indicators and moving averages registered at the time this technical analysis was created:
| RSI (14): | 43.30 | |
| MACD (12,26,9): | -0.5000 | |
| Directional Movement: | -8.02 | |
| AROON (14): | -28.57 | |
| DEMA (21): | 32.89 | |
| Parabolic SAR (0,02-0,02-0,2): | 30.52 | |
| Elder Ray (13): | -0.65 | |
| Super Trend (3,10): | 35.38 | |
| Zig ZAG (10): | 32.19 | |
| VORTEX (21): | 0.8500 | |
| Stochastique (14,3,5): | 33.08 | |
| TEMA (21): | 31.87 | |
| Williams %R (14): | -73.15 | |
| Chande Momentum Oscillator (20): | -2.29 | |
| Repulse (5,40,3): | -3.9800 | |
| ROCnROLL: | 2 | |
| TRIX (15,9): | -0.1600 | |
| Courbe Coppock: | 17.83 |
| MA7: | 32.81 | |
| MA20: | 33.89 | |
| MA50: | 34.15 | |
| MA100: | 29.54 | |
| MAexp7: | 32.69 | |
| MAexp20: | 33.38 | |
| MAexp50: | 32.88 | |
| MAexp100: | 31.49 | |
| Price / MA7: | -1.89% | |
| Price / MA20: | -5.02% | |
| Price / MA50: | -5.74% | |
| Price / MA100: | +8.97% | |
| Price / MAexp7: | -1.53% | |
| Price / MAexp20: | -3.57% | |
| Price / MAexp50: | -2.10% | |
| Price / MAexp100: | +2.22% |
News
Don"t forget to follow the news on TRUPANION INC.. At the time of publication of this analysis, the latest news was as follows:
- Trupanion to Present at the 22nd Annual Needham Growth Conference
- Trupanion Marks One Millionth Veterinary Invoice Milestone
- Trupanion Leads the Pack with Technology and Innovation, Wins ‘Innovation in Insurance Award’
- Trupanion Announces Upcoming Investor Conference Participation
- Trupanion Reports Third Quarter 2019 Results
About author

Online


Add a comment
Comments
0 comments on the analysis TRUPANION INC. - Daily