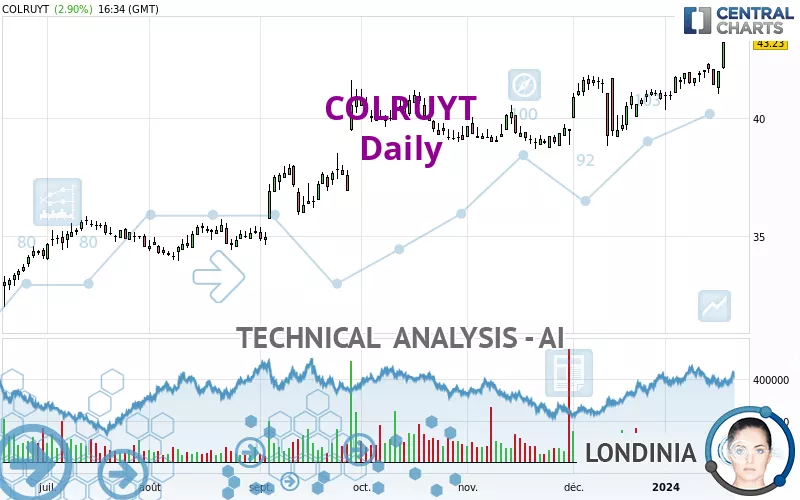
COLRUYT - Daily - Technical analysis published on 01/19/2024 (GMT)
- 147
- 0
Click here for a new analysis!
- Timeframe : Daily
- - Analysis generated on
- Status : INVALID
Summary of the analysis

Additional analysis
Quotes
The COLRUYT rating is 43.23 EUR. The price has increased by +2.90% since the last closing and was between 42.07 EUR and 43.23 EUR. This implies that the price is at +2.76% from its lowest and at 0% from its highest.The Central Gaps scanner detects a bullish gap which is a sign that buyers have taken the lead in the very short term.
Opening Gap UP
Type : Bullish
Timeframe : Openning
Here is a more detailed summary of the historical variations registered by COLRUYT:
New HIGH record (1 year)
Type : Bullish
Timeframe : Weekly
New HIGH record (1st january)
Type : Bullish
Timeframe : Weekly
New HIGH record (1 month)
Type : Bullish
Timeframe : Weekly
Technical
Technical analysis of this Daily chart of COLRUYT indicates that the overall trend is strongly bullish. 92.86% of the signals given by moving averages are bullish. The overall trend is supported by the strong bullish signals from short-term moving averages. The Central Indicators scanner does not detect any result on moving averages that would impact this trend.
An assessment of technical indicators shows a strong bullish signal.
Caution: the Central Indicators scanner currently detects an excess:
CCI indicator is overbought : over 100
Type : Neutral
Timeframe : Daily
Williams %R indicator is overbought : over -20
Type : Neutral
Timeframe : Daily
Pivot points : price is over resistance 2
Type : Neutral
Timeframe : Daily
Pivot points : price is over resistance 3
Type : Neutral
Timeframe : Weekly
SuperTrend indicator bullish reversal
Type : Bullish
Timeframe : Daily
The Central Patterns scanner, which studies chart patterns, resistances and supports, has identified this signal:
Near resistance of channel
Type : Bearish
Timeframe : Daily
For a small rebound in the very short term, the Central Candlesticks scanner currently notes the presence of this bullish pattern in Japanese candlesticks:
Upside gap
Type : Bullish
Timeframe : Daily
| S3 | S2 | S1 | Price | R1 | R2 | R3 | |
|---|---|---|---|---|---|---|---|
| ProTrendLines | 31.82 | 34.55 | 40.42 | 43.23 | 43.51 | 46.84 | 49.37 |
| Change (%) | -26.39% | -20.08% | -6.50% | - | +0.65% | +8.35% | +14.20% |
| Change | -11.41 | -8.68 | -2.81 | - | +0.28 | +3.61 | +6.14 |
| Level | Minor | Major | Major | - | Intermediate | Intermediate | Minor |
Pivot points can also be used to set your price objectives. Here is the price situation in relation to pivot points:
| Pivot points | S3 | S2 | S1 | PP | R1 | R2 | R3 |
|---|---|---|---|---|---|---|---|
| Standard | 41.30 | 41.68 | 42.46 | 42.84 | 43.62 | 44.00 | 44.78 |
| Camarilla | 42.91 | 43.02 | 43.12 | 43.23 | 43.34 | 43.44 | 43.55 |
| Woodie | 41.49 | 41.78 | 42.65 | 42.94 | 43.81 | 44.10 | 44.97 |
| Fibonacci | 41.68 | 42.13 | 42.40 | 42.84 | 43.29 | 43.56 | 44.00 |
| Pivot points | S3 | S2 | S1 | PP | R1 | R2 | R3 |
|---|---|---|---|---|---|---|---|
| Standard | 40.90 | 41.12 | 41.58 | 41.80 | 42.26 | 42.48 | 42.94 |
| Camarilla | 41.84 | 41.91 | 41.97 | 42.03 | 42.09 | 42.16 | 42.22 |
| Woodie | 41.01 | 41.18 | 41.69 | 41.86 | 42.37 | 42.54 | 43.05 |
| Fibonacci | 41.12 | 41.38 | 41.54 | 41.80 | 42.06 | 42.22 | 42.48 |
| Pivot points | S3 | S2 | S1 | PP | R1 | R2 | R3 |
|---|---|---|---|---|---|---|---|
| Standard | 36.14 | 37.48 | 39.14 | 40.48 | 42.14 | 43.48 | 45.14 |
| Camarilla | 39.98 | 40.25 | 40.53 | 40.80 | 41.08 | 41.35 | 41.63 |
| Woodie | 36.30 | 37.56 | 39.30 | 40.56 | 42.30 | 43.56 | 45.30 |
| Fibonacci | 37.48 | 38.63 | 39.33 | 40.48 | 41.63 | 42.33 | 43.48 |
Numerical data
The following is the status of technical indicators and moving averages registered at the time this technical analysis was created:
| RSI (14): | 68.72 | |
| MACD (12,26,9): | 0.5300 | |
| Directional Movement: | 13.13 | |
| AROON (14): | 85.71 | |
| DEMA (21): | 42.20 | |
| Parabolic SAR (0,02-0,02-0,2): | 40.64 | |
| Elder Ray (13): | 0.83 | |
| Super Trend (3,10): | 40.65 | |
| Zig ZAG (10): | 43.23 | |
| VORTEX (21): | 1.1700 | |
| Stochastique (14,3,5): | 79.56 | |
| TEMA (21): | 42.37 | |
| Williams %R (14): | 0.00 | |
| Chande Momentum Oscillator (20): | 2.25 | |
| Repulse (5,40,3): | 4.3900 | |
| ROCnROLL: | 1 | |
| TRIX (15,9): | 0.1500 | |
| Courbe Coppock: | 6.00 |
| MA7: | 42.05 | |
| MA20: | 41.47 | |
| MA50: | 40.51 | |
| MA100: | 39.34 | |
| MAexp7: | 42.14 | |
| MAexp20: | 41.54 | |
| MAexp50: | 40.64 | |
| MAexp100: | 39.02 | |
| Price / MA7: | +2.81% | |
| Price / MA20: | +4.24% | |
| Price / MA50: | +6.71% | |
| Price / MA100: | +9.89% | |
| Price / MAexp7: | +2.59% | |
| Price / MAexp20: | +4.07% | |
| Price / MAexp50: | +6.37% | |
| Price / MAexp100: | +10.79% |
News
Don't forget to follow the news on COLRUYT. At the time of publication of this analysis, the latest news was as follows:
- Shekel supplies Belgian retailer Colruyt dozens of smart refrigerators
- Colruyt Group to Optimize Business Operations and Customer Experience with New Cloud-Managed Networking Solution from Extreme Networks
-
 Colruyt
About author
Online


Add a comment
Comments
0 comments on the analysis COLRUYT - Daily