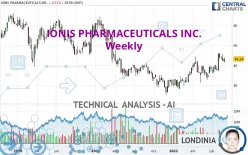
IONIS PHARMACEUTICALS INC. - Weekly - Technical analysis published on 09/05/2022 (GMT)
- 217
- 0
Click here for a new analysis!
- Timeframe : Weekly
- - Analysis generated on
- Status : TARGET REACHED

Summary of the analysis

Additional analysis
Quotes
The IONIS PHARMACEUTICALS INC. price is 43.24 USD. The price is up +2.95% over 5 days and was traded between 42.15 USD and 44.11 USD over the period. The price is currently at +2.59% from its lowest point and -1.97% from its highest point.A bullish gap was detected at the opening by the Central Gaps scanner. There are a lot of buyers and they have the upper hand in the very short term.
Opening Gap UP
Type : Bullish
Timeframe : Openning
A study of price movements over other periods shows the following variations:
Near a new HIGH record (1 year)
Type : Bullish
Timeframe : Weekly
Near a new HIGH record (1st january)
Type : Bullish
Timeframe : Weekly
Near a new HIGH record (1 month)
Type : Bullish
Timeframe : Weekly
Technical
Technical analysis of IONIS PHARMACEUTICALS INC. in Weekly shows an overall bullish trend. 67.86% of the signals given by moving averages are bullish. This bullish trend is supported by the strong bullish signals given by short-term moving averages. The Central Indicators scanner does not detect any result on moving averages that would impact this trend.
In fact, according to the parameters integrated into the Central Analyzer system, 14 technical indicators out of 18 analysed are currently bullish. But beware of excesses. The Central Indicators scanner currently detects this:
CCI indicator is overbought : over 100
Type : Neutral
Timeframe : Weekly
An analysis of the price chart with the Central Patterns scanner (detector of chart patterns and resistances and supports) shows several results that can have an impact on the price change:
Near resistance of channel
Type : Bearish
Timeframe : Weekly
Near resistance of triangle
Type : Bearish
Timeframe : Weekly
Near horizontal support
Type : Bullish
Timeframe : Weekly
Central Candlesticks, the scanner specialised in Japanese candlesticks, detects a bullish signal that could support the hypothesis of a small rebound in the very short term:
Piercing line
Type : Bullish
Timeframe : Weekly
| S3 | S2 | S1 | Price | R1 | R2 | R3 | |
|---|---|---|---|---|---|---|---|
| ProTrendLines | 25.61 | 31.71 | 43.00 | 43.24 | 53.85 | 63.37 | 86.14 |
| Change (%) | -40.77% | -26.67% | -0.56% | - | +24.54% | +46.55% | +99.21% |
| Change | -17.63 | -11.53 | -0.24 | - | +10.61 | +20.13 | +42.90 |
| Level | Minor | Major | Major | - | Minor | Major | Intermediate |
Pivot points can also be used to set your price objectives. Here is the price situation in relation to pivot points:
| Pivot points | S3 | S2 | S1 | PP | R1 | R2 | R3 |
|---|---|---|---|---|---|---|---|
| Standard | 41.68 | 42.34 | 42.79 | 43.45 | 43.90 | 44.56 | 45.01 |
| Camarilla | 42.94 | 43.04 | 43.14 | 43.24 | 43.34 | 43.44 | 43.55 |
| Woodie | 41.58 | 42.29 | 42.69 | 43.40 | 43.80 | 44.51 | 44.91 |
| Fibonacci | 42.34 | 42.76 | 43.03 | 43.45 | 43.87 | 44.14 | 44.56 |
| Pivot points | S3 | S2 | S1 | PP | R1 | R2 | R3 |
|---|---|---|---|---|---|---|---|
| Standard | 37.83 | 40.00 | 41.17 | 43.34 | 44.51 | 46.68 | 47.85 |
| Camarilla | 41.43 | 41.74 | 42.04 | 42.35 | 42.66 | 42.96 | 43.27 |
| Woodie | 37.34 | 39.75 | 40.68 | 43.09 | 44.02 | 46.43 | 47.36 |
| Fibonacci | 40.00 | 41.27 | 42.06 | 43.34 | 44.61 | 45.40 | 46.68 |
| Pivot points | S3 | S2 | S1 | PP | R1 | R2 | R3 |
|---|---|---|---|---|---|---|---|
| Standard | 28.58 | 32.82 | 37.67 | 41.91 | 46.76 | 51.00 | 55.85 |
| Camarilla | 40.02 | 40.85 | 41.69 | 42.52 | 43.35 | 44.19 | 45.02 |
| Woodie | 28.89 | 32.97 | 37.98 | 42.06 | 47.07 | 51.15 | 56.16 |
| Fibonacci | 32.82 | 36.29 | 38.44 | 41.91 | 45.38 | 47.53 | 51.00 |
Numerical data
The following is the status of technical indicators and moving averages registered at the time this technical analysis was created:
| RSI (14): | 59.42 | |
| MACD (12,26,9): | 2.0300 | |
| Directional Movement: | 8.88 | |
| AROON (14): | 57.14 | |
| DEMA (21): | 42.08 | |
| Parabolic SAR (0,02-0,02-0,2): | 33.41 | |
| Elder Ray (13): | 2.04 | |
| Super Trend (3,10): | 33.27 | |
| Zig ZAG (10): | 43.24 | |
| VORTEX (21): | 1.0500 | |
| Stochastique (14,3,5): | 77.86 | |
| TEMA (21): | 43.60 | |
| Williams %R (14): | -21.81 | |
| Chande Momentum Oscillator (20): | 8.48 | |
| Repulse (5,40,3): | 2.2700 | |
| ROCnROLL: | 1 | |
| TRIX (15,9): | 0.6400 | |
| Courbe Coppock: | 26.19 |
| MA7: | 42.76 | |
| MA20: | 43.81 | |
| MA50: | 40.64 | |
| MA100: | 39.05 | |
| MAexp7: | 42.17 | |
| MAexp20: | 39.66 | |
| MAexp50: | 38.38 | |
| MAexp100: | 40.92 | |
| Price / MA7: | +1.12% | |
| Price / MA20: | -1.30% | |
| Price / MA50: | +6.40% | |
| Price / MA100: | +10.73% | |
| Price / MAexp7: | +2.54% | |
| Price / MAexp20: | +9.03% | |
| Price / MAexp50: | +12.66% | |
| Price / MAexp100: | +5.67% |
News
Don't forget to follow the news on IONIS PHARMACEUTICALS INC.. At the time of publication of this analysis, the latest news was as follows:
- Ionis to present at upcoming investor conferences
- Ionis reports second quarter financial results and recent business achievements
- Ionis announces positive topline results from Phase 2b clinical study of fesomersen, a potential novel anti-thrombotic treatment
- Ionis to hold second quarter 2022 financial results webcast
- Ionis announces that FDA accepts New Drug Application and grants Priority Review of tofersen for a rare, genetic form of ALS
About author

Online


Add a comment
Comments
0 comments on the analysis IONIS PHARMACEUTICALS INC. - Weekly