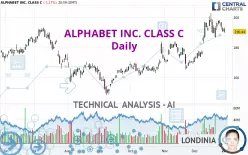
ALPHABET INC. CLASS C - Daily - Technical analysis published on 01/01/2025 (GMT)
- 268
- 0
Click here for a new analysis!
- Timeframe : Daily
- - Analysis generated on
- Status : TARGET REACHED

Summary of the analysis

Additional analysis
Quotes
ALPHABET INC. CLASS C rating 190.44 USD. On the day, this instrument lost -1.17% with the lowest point at 189.58 USD and the highest point at 193.25 USD. The deviation from the price is +0.45% for the low point and -1.45% for the high point.So that you have an overall view of the price change, here is a table showing the variations over several periods:
Near a new HIGH record (5 years)
Type : Bullish
Timeframe : Weekly
Near a new HIGH record (1 year)
Type : Bullish
Timeframe : Weekly
Near a new HIGH record (1st january)
Type : Bullish
Timeframe : Weekly
Near a new HIGH record (1 month)
Type : Bullish
Timeframe : Weekly
Technical
Technical analysis of this Daily chart of ALPHABET INC. CLASS C indicates that the overall trend is strongly bullish. The signals given by the moving averages are 92.86% bullish. This strong bullish trend is confirmed by the strong signals currently being given by short-term moving averages. The Central Indicators scanner does not detect any result on moving averages that would impact this trend.
The probability of a further decline is low given the direction of the technical indicators.
Other results related to technical indicators were also found by the Central Indicators scanner:
Pivot points : price is under support 1
Type : Neutral
Timeframe : Daily
Pivot points : price is under support 1
Type : Neutral
Timeframe : Weekly
Central Patterns, the scanner specializing in chart patterns, did not identify any signals.
No result was found by the Central Candlesticks scanner on Japanese candlesticks.
| S3 | S2 | S1 | Price | R1 | R2 | |
|---|---|---|---|---|---|---|
| ProTrendLines | 150.17 | 166.45 | 172.97 | 190.44 | 192.19 | 198.16 |
| Change (%) | -21.15% | -12.60% | -9.17% | - | +0.92% | +4.05% |
| Change | -40.27 | -23.99 | -17.47 | - | +1.75 | +7.72 |
| Level | Major | Major | Major | - | Major | Major |
Attention could also be paid to pivot points to set price objectives:
| Pivot points | S3 | S2 | S1 | PP | R1 | R2 | R3 |
|---|---|---|---|---|---|---|---|
| Standard | 185.26 | 187.42 | 188.93 | 191.09 | 192.60 | 194.76 | 196.27 |
| Camarilla | 189.43 | 189.77 | 190.10 | 190.44 | 190.78 | 191.11 | 191.45 |
| Woodie | 184.94 | 187.26 | 188.61 | 190.93 | 192.28 | 194.60 | 195.95 |
| Fibonacci | 187.42 | 188.82 | 189.69 | 191.09 | 192.49 | 193.36 | 194.76 |
| Pivot points | S3 | S2 | S1 | PP | R1 | R2 | R3 |
|---|---|---|---|---|---|---|---|
| Standard | 184.53 | 188.08 | 191.06 | 194.61 | 197.59 | 201.14 | 204.12 |
| Camarilla | 192.24 | 192.84 | 193.44 | 194.04 | 194.64 | 195.24 | 195.84 |
| Woodie | 184.25 | 187.94 | 190.78 | 194.47 | 197.31 | 201.00 | 203.84 |
| Fibonacci | 188.08 | 190.57 | 192.12 | 194.61 | 197.10 | 198.65 | 201.14 |
| Pivot points | S3 | S2 | S1 | PP | R1 | R2 | R3 |
|---|---|---|---|---|---|---|---|
| Standard | 143.64 | 154.38 | 162.34 | 173.08 | 181.04 | 191.78 | 199.74 |
| Camarilla | 165.16 | 166.87 | 168.59 | 170.30 | 172.01 | 173.73 | 175.44 |
| Woodie | 142.25 | 153.69 | 160.95 | 172.39 | 179.65 | 191.09 | 198.35 |
| Fibonacci | 154.38 | 161.52 | 165.94 | 173.08 | 180.22 | 184.64 | 191.78 |
Numerical data
The following is the status of technical indicators and moving averages registered at the time this technical analysis was created:
| RSI (14): | 54.80 | |
| MACD (12,26,9): | 4.7800 | |
| Directional Movement: | 4.95 | |
| AROON (14): | 35.71 | |
| DEMA (21): | 195.75 | |
| Parabolic SAR (0,02-0,02-0,2): | 202.63 | |
| Elder Ray (13): | -0.31 | |
| Super Trend (3,10): | 184.36 | |
| Zig ZAG (10): | 190.44 | |
| VORTEX (21): | 1.1100 | |
| Stochastique (14,3,5): | 47.52 | |
| TEMA (21): | 196.87 | |
| Williams %R (14): | -74.85 | |
| Chande Momentum Oscillator (20): | -3.19 | |
| Repulse (5,40,3): | -0.6200 | |
| ROCnROLL: | -1 | |
| TRIX (15,9): | 0.4300 | |
| Courbe Coppock: | 14.18 |
| MA7: | 194.41 | |
| MA20: | 189.02 | |
| MA50: | 179.35 | |
| MA100: | 171.13 | |
| MAexp7: | 193.13 | |
| MAexp20: | 189.24 | |
| MAexp50: | 181.55 | |
| MAexp100: | 175.64 | |
| Price / MA7: | -2.04% | |
| Price / MA20: | +0.75% | |
| Price / MA50: | +6.18% | |
| Price / MA100: | +11.28% | |
| Price / MAexp7: | -1.39% | |
| Price / MAexp20: | +0.63% | |
| Price / MAexp50: | +4.90% | |
| Price / MAexp100: | +8.43% |
News
The latest news and videos published on ALPHABET INC. CLASS C at the time of the analysis were as follows:
- Kaskela Law LLC Announces Shareholder Class Action Lawsuit Filed Against Alphabet, Inc. - GOOG GOOGL
- INVESTOR ALERT: Kaskela Law LLC Announces Class Action Lawsuit Against Alphabet, Inc. and Encourages Investors to Contact the Firm - GOOG
- Investor Network: Alphabet Inc. Class A to Host Earnings Call
About author

Online


Add a comment
Comments
0 comments on the analysis ALPHABET INC. CLASS C - Daily