| Open: | - |
| Change: | - |
| Volume: | - |
| Low: | - |
| High: | - |
| High / Low range: | - |
| Type: | Stocks |
| Ticker: | COH |
| ISIN: | FR0004031763 |
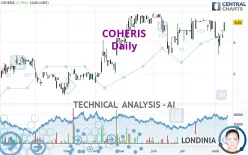
COHERIS - Daily - Technical analysis published on 08/09/2024 (GMT)
- 132
- 0
- 08/09/2024 - 13:35
Click here for a new analysis!
- Timeframe : Daily
- - Analysis generated on 08/09/2024 - 13:35
- Status : INVALID

Summary of the analysis

Additional analysis
Quotes
COHERIS rating 6.64 EUR. The price registered an increase of +7.79% on the session and was traded between 6.38 EUR and 6.64 EUR over the period. The price is currently at +4.08% from its lowest and 0% from its highest.A bullish opening was detected by the Central Gaps scanner. Buyers are trying to impose a bullish momentum in the very short term.
Bullish opening
Type : Bullish
Timeframe : Openning
So that you have an overall view of the price change, here is a table showing the variations over several periods:
Near a new HIGH record (5 years)
Type : Bullish
Timeframe : Weekly
Near a new HIGH record (1 year)
Type : Bullish
Timeframe : Weekly
Near a new HIGH record (1st january)
Type : Bullish
Timeframe : Weekly
Near a new HIGH record (1 month)
Type : Bullish
Timeframe : Weekly
Technical
A technical analysis in Daily of this COHERIS chart shows a strongly bullish trend. 82.14% of the signals given by moving averages are bullish. The slightly bullish signals given by the short-term moving averages indicate this trend is showing signs of running out of steam. The Central Indicators market scanner is currently detecting several bullish signals that could impact this trend:
Bullish price crossover with Moving Average 20
Type : Bullish
Timeframe : Daily
Bullish price crossover with Moving Average 50
Type : Bullish
Timeframe : Daily
Bullish price crossover with adaptative moving average 20
Type : Bullish
Timeframe : Daily
Bullish price crossover with adaptative moving average 50
Type : Bullish
Timeframe : Daily
Bullish price crossover with adaptative moving average 100
Type : Bullish
Timeframe : Daily
In fact, of the 18 technical indicators analysed by Central Analyzer, 9 are bullish, 5 are neutral and 4 are bearish. Caution: the Central Indicators scanner currently detects an excess:
CCI indicator: bullish divergence
Type : Bullish
Timeframe : Daily
Williams %R indicator is overbought : over -20
Type : Neutral
Timeframe : Daily
Pivot points : price is over resistance 1
Type : Neutral
Timeframe : Weekly
Pivot points : price is over resistance 3
Type : Neutral
Timeframe : Daily
RSI indicator is back over 50
Type : Bullish
Timeframe : Daily
Parabolic SAR indicator bullish reversal
Type : Bullish
Timeframe : Daily
The Central Patterns scanner, which studies chart patterns, resistances and supports, has identified these signals:
Near resistance of channel
Type : Bearish
Timeframe : Daily
Horizontal resistance is broken
Type : Bullish
Timeframe : Daily
No result was found by the Central Candlesticks scanner on Japanese candlesticks.
| S3 | S2 | S1 | Price | R1 | |
|---|---|---|---|---|---|
| ProTrendLines | 5.09 | 5.88 | 6.42 | 6.64 | 6.81 |
| Change (%) | -23.34% | -11.45% | -3.31% | - | +2.56% |
| Change | -1.55 | -0.76 | -0.22 | - | +0.17 |
| Level | Minor | Major | Minor | - | Major |
Attention could also be paid to pivot points to set price objectives:
| Pivot points | S3 | S2 | S1 | PP | R1 | R2 | R3 |
|---|---|---|---|---|---|---|---|
| Standard | 5.84 | 6.00 | 6.08 | 6.24 | 6.32 | 6.48 | 6.56 |
| Camarilla | 6.09 | 6.12 | 6.14 | 6.16 | 6.18 | 6.20 | 6.23 |
| Woodie | 5.80 | 5.98 | 6.04 | 6.22 | 6.28 | 6.46 | 6.52 |
| Fibonacci | 6.00 | 6.09 | 6.15 | 6.24 | 6.33 | 6.39 | 6.48 |
| Pivot points | S3 | S2 | S1 | PP | R1 | R2 | R3 |
|---|---|---|---|---|---|---|---|
| Standard | 5.36 | 5.74 | 5.94 | 6.32 | 6.52 | 6.90 | 7.10 |
| Camarilla | 5.98 | 6.03 | 6.09 | 6.14 | 6.19 | 6.25 | 6.30 |
| Woodie | 5.27 | 5.70 | 5.85 | 6.28 | 6.43 | 6.86 | 7.01 |
| Fibonacci | 5.74 | 5.96 | 6.10 | 6.32 | 6.54 | 6.68 | 6.90 |
| Pivot points | S3 | S2 | S1 | PP | R1 | R2 | R3 |
|---|---|---|---|---|---|---|---|
| Standard | 5.47 | 5.75 | 6.21 | 6.49 | 6.95 | 7.23 | 7.69 |
| Camarilla | 6.46 | 6.52 | 6.59 | 6.66 | 6.73 | 6.80 | 6.86 |
| Woodie | 5.55 | 5.80 | 6.29 | 6.54 | 7.03 | 7.28 | 7.77 |
| Fibonacci | 5.75 | 6.04 | 6.21 | 6.49 | 6.78 | 6.95 | 7.23 |
Numerical data
The following is the status of the technical indicators and moving averages at the time of publication of this technical analysis:
| RSI (14): | 54.78 | |
| MACD (12,26,9): | -0.0300 | |
| Directional Movement: | -20.58 | |
| AROON (14): | -71.43 | |
| DEMA (21): | 6.42 | |
| Parabolic SAR (0,02-0,02-0,2): | 5.62 | |
| Elder Ray (13): | 0.09 | |
| Super Trend (3,10): | 6.87 | |
| Zig ZAG (10): | 6.64 | |
| VORTEX (21): | 0.8000 | |
| Stochastique (14,3,5): | 70.08 | |
| TEMA (21): | 6.36 | |
| Williams %R (14): | -5.56 | |
| Chande Momentum Oscillator (20): | -0.06 | |
| Repulse (5,40,3): | 6.1500 | |
| ROCnROLL: | 1 | |
| TRIX (15,9): | 0.0000 | |
| Courbe Coppock: | 8.80 |
| MA7: | 6.33 | |
| MA20: | 6.51 | |
| MA50: | 6.43 | |
| MA100: | 6.07 | |
| MAexp7: | 6.39 | |
| MAexp20: | 6.44 | |
| MAexp50: | 6.38 | |
| MAexp100: | 6.11 | |
| Price / MA7: | +4.90% | |
| Price / MA20: | +2.00% | |
| Price / MA50: | +3.27% | |
| Price / MA100: | +9.39% | |
| Price / MAexp7: | +3.91% | |
| Price / MAexp20: | +3.11% | |
| Price / MAexp50: | +4.08% | |
| Price / MAexp100: | +8.67% |
News
The latest news and videos published on COHERIS at the time of the analysis were as follows:
-
02/08/2017 - 00:45
 Coheris
About author
Online


Add a comment
Comments
0 comments on the analysis COHERIS - Daily