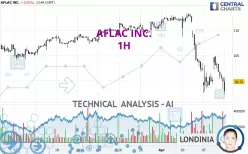
AFLAC INC. - 1H - Technical analysis published on 04/09/2025 (GMT)
- 79
- 0
Click here for a new analysis!
- Timeframe : 1H
- - Analysis generated on
- Status : INVALID

Summary of the analysis

Additional analysis
Quotes
The AFLAC INC. rating is 99.76 USD. The price is lower by -0.01% since the last closing with the lowest point at 97.20 USD and the highest point at 100.64 USD. The deviation from the price is +2.63% for the low point and -0.87% for the high point.The Central Gaps scanner detects the formation of a bullish gap marking the strong presence of buyers against sellers at the opening. This formed a quotation gap.
Opening Gap UP
Type : Bullish
Timeframe : Openning
A study of price movements over other periods shows the following variations:
Near a new LOW record (1st january)
Type : Bearish
Timeframe : Weekly
Near a new LOW record (1 month)
Type : Bearish
Timeframe : Weekly
Technical
Technical analysis of AFLAC INC. in 1H shows a overall strongly bearish trend. 92.86% of the signals given by moving averages are bearish. The overall trend is supported by the strong bearish signals from short-term moving averages. There is no crossing of moving average by the price or crossing of moving averages between themselves.
An assessment of technical indicators does not currently provide any relevant information on the direction of future price movements.
But beware of excesses. The Central Indicators scanner currently detects this:
Williams %R indicator is oversold : under -80
Type : Neutral
Timeframe : 1 hour
Price is back under the pivot point (Daily)
Type : Bearish
Timeframe : 1 hour
Pivot points : price is under support 1 (Monthly)
Type : Neutral
Timeframe : 1 hour
The analysis of the price chart with Central Patterns scanners does not return any result.
The Central Candlesticks scanner which studies Japanese candlesticks did not detect anything.
| S3 | S2 | S1 | Price | R1 | R2 | R3 | |
|---|---|---|---|---|---|---|---|
| ProTrendLines | 87.21 | 93.11 | 97.48 | 99.76 | 99.81 | 102.08 | 104.67 |
| Change (%) | -12.58% | -6.67% | -2.29% | - | +0.05% | +2.33% | +4.92% |
| Change | -12.55 | -6.65 | -2.28 | - | +0.05 | +2.32 | +4.91 |
| Level | Minor | Minor | Intermediate | - | Major | Minor | Intermediate |
To determine price objectives, it is also possible to use the pivot points. Here is the price position in relation to pivot points:
| Pivot points | S3 | S2 | S1 | PP | R1 | R2 | R3 |
|---|---|---|---|---|---|---|---|
| Standard | 90.50 | 94.41 | 97.09 | 101.00 | 103.68 | 107.59 | 110.27 |
| Camarilla | 97.96 | 98.56 | 99.17 | 99.77 | 100.37 | 100.98 | 101.58 |
| Woodie | 89.89 | 94.10 | 96.48 | 100.69 | 103.07 | 107.28 | 109.66 |
| Fibonacci | 94.41 | 96.93 | 98.48 | 101.00 | 103.52 | 105.07 | 107.59 |
| Pivot points | S3 | S2 | S1 | PP | R1 | R2 | R3 |
|---|---|---|---|---|---|---|---|
| Standard | 86.42 | 94.12 | 98.05 | 105.75 | 109.68 | 117.38 | 121.31 |
| Camarilla | 98.78 | 99.85 | 100.91 | 101.98 | 103.05 | 104.11 | 105.18 |
| Woodie | 84.54 | 93.18 | 96.17 | 104.81 | 107.80 | 116.44 | 119.43 |
| Fibonacci | 94.12 | 98.56 | 101.31 | 105.75 | 110.19 | 112.94 | 117.38 |
| Pivot points | S3 | S2 | S1 | PP | R1 | R2 | R3 |
|---|---|---|---|---|---|---|---|
| Standard | 98.77 | 101.49 | 106.34 | 109.06 | 113.91 | 116.63 | 121.48 |
| Camarilla | 109.11 | 109.80 | 110.50 | 111.19 | 111.88 | 112.58 | 113.27 |
| Woodie | 99.84 | 102.02 | 107.41 | 109.59 | 114.98 | 117.16 | 122.55 |
| Fibonacci | 101.49 | 104.38 | 106.17 | 109.06 | 111.95 | 113.74 | 116.63 |
Numerical data
The following are the details of the technical indicators and moving averages that were collected to generate this technical analysis:
| RSI (14): | 32.54 | |
| MACD (12,26,9): | -2.1000 | |
| Directional Movement: | -17.56 | |
| AROON (14): | -42.86 | |
| DEMA (21): | 99.62 | |
| Parabolic SAR (0,02-0,02-0,2): | 104.78 | |
| Elder Ray (13): | -3.08 | |
| Super Trend (3,10): | 97.18 | |
| Zig ZAG (10): | 99.79 | |
| VORTEX (21): | 0.7700 | |
| Stochastique (14,3,5): | 34.08 | |
| TEMA (21): | 99.22 | |
| Williams %R (14): | -70.95 | |
| Chande Momentum Oscillator (20): | 0.13 | |
| Repulse (5,40,3): | 1.5700 | |
| ROCnROLL: | 2 | |
| TRIX (15,9): | -0.3200 | |
| Courbe Coppock: | 2.13 |
| MA7: | 105.39 | |
| MA20: | 107.59 | |
| MA50: | 106.38 | |
| MA100: | 105.98 | |
| MAexp7: | 100.71 | |
| MAexp20: | 102.45 | |
| MAexp50: | 105.64 | |
| MAexp100: | 107.16 | |
| Price / MA7: | -5.34% | |
| Price / MA20: | -7.28% | |
| Price / MA50: | -6.22% | |
| Price / MA100: | -5.87% | |
| Price / MAexp7: | -0.94% | |
| Price / MAexp20: | -2.63% | |
| Price / MAexp50: | -5.57% | |
| Price / MAexp100: | -6.91% |
News
The last news published on AFLAC INC. at the time of the generation of this analysis was as follows:
- Aflac Incorporated to Release First Quarter Results and CFO Video Update on April 30, 2025 and Host Webcast on May 1, 2025
- TOGETHXR and Aflac Put More Ducks in a Row for Women's Sports
- Aflac is a World's Most Ethical Company for 19th year in a row
- Aflac hires 30-year industry leader Michael Fradkin to lead its Dental and Vision business
- Aflac and the American Cancer Society Team Up to encourage proactive health care and early detection
About author
Online


Add a comment
Comments
0 comments on the analysis AFLAC INC. - 1H