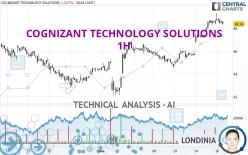
COGNIZANT TECHNOLOGY SOLUTIONS - 1H - Technical analysis published on 11/16/2023 (GMT)
- 233
- 0
Click here for a new analysis!
- Timeframe : 1H
- - Analysis generated on
- Status : TARGET REACHED

Summary of the analysis

Additional analysis
Quotes
COGNIZANT TECHNOLOGY SOLUTIONS rating 68.37 USD. The price registered a decrease of -0.06% on the session and was traded between 68.37 USD and 69.32 USD over the period. The price is currently at 0% from its lowest and -1.37% from its highest.A bullish opening was detected by the Central Gaps scanner. Buyers are trying to impose a bullish momentum in the very short term.
Bullish opening
Type : Bullish
Timeframe : Openning
So that you have an overall view of the price change, here is a table showing the variations over several periods:
Near a new HIGH record (1 year)
Type : Bullish
Timeframe : Weekly
Near a new HIGH record (1st january)
Type : Bullish
Timeframe : Weekly
New HIGH record (1 month)
Type : Bullish
Timeframe : Weekly
Technical
Technical analysis of COGNIZANT TECHNOLOGY SOLUTIONS in 1H shows a strongly overall bullish trend. 92.86% of the signals given by moving averages are bullish. This strongly bullish trend is supported by the strong bullish signals given by short-term moving averages. The Central Indicators market scanner currently does not detect any result that concerns moving averages.
In fact, according to the parameters integrated into the Central Analyzer system, 11 technical indicators out of 18 analysed are currently bullish. Central Indicators, the detector scanner for these technical indicators recently detected a signal:
Pivot points : price is over resistance 2
Type : Neutral
Timeframe : Weekly
An analysis of the price chart with the Central Patterns scanner (detector of chart patterns and resistances and supports) shows a result that can have an impact on the price change:
Near resistance of triangle
Type : Bearish
Timeframe : 1 hour
The Central Candlesticks scanner, specialised in Japanese candlesticks, did not identify any signals.
| S3 | S2 | S1 | Price | R1 | R2 | R3 | |
|---|---|---|---|---|---|---|---|
| ProTrendLines | 65.15 | 66.10 | 67.26 | 68.37 | 68.60 | 69.69 | 71.73 |
| Change (%) | -4.71% | -3.32% | -1.62% | - | +0.34% | +1.93% | +4.91% |
| Change | -3.22 | -2.27 | -1.11 | - | +0.23 | +1.32 | +3.36 |
| Level | Intermediate | Minor | Intermediate | - | Intermediate | Major | Intermediate |
To determine price objectives, it is also possible to use the pivot points. Here is the price position in relation to pivot points:
| Pivot points | S3 | S2 | S1 | PP | R1 | R2 | R3 |
|---|---|---|---|---|---|---|---|
| Standard | 66.09 | 66.70 | 67.56 | 68.17 | 69.03 | 69.64 | 70.50 |
| Camarilla | 68.01 | 68.14 | 68.28 | 68.41 | 68.55 | 68.68 | 68.81 |
| Woodie | 66.21 | 66.76 | 67.68 | 68.23 | 69.15 | 69.70 | 70.62 |
| Fibonacci | 66.70 | 67.27 | 67.61 | 68.17 | 68.74 | 69.08 | 69.64 |
| Pivot points | S3 | S2 | S1 | PP | R1 | R2 | R3 |
|---|---|---|---|---|---|---|---|
| Standard | 62.68 | 63.58 | 64.77 | 65.67 | 66.86 | 67.76 | 68.95 |
| Camarilla | 65.38 | 65.57 | 65.76 | 65.95 | 66.14 | 66.33 | 66.53 |
| Woodie | 62.82 | 63.65 | 64.91 | 65.74 | 67.00 | 67.83 | 69.09 |
| Fibonacci | 63.58 | 64.38 | 64.88 | 65.67 | 66.47 | 66.97 | 67.76 |
| Pivot points | S3 | S2 | S1 | PP | R1 | R2 | R3 |
|---|---|---|---|---|---|---|---|
| Standard | 56.16 | 59.48 | 61.97 | 65.29 | 67.78 | 71.10 | 73.59 |
| Camarilla | 62.87 | 63.41 | 63.94 | 64.47 | 65.00 | 65.54 | 66.07 |
| Woodie | 55.76 | 59.27 | 61.57 | 65.08 | 67.38 | 70.89 | 73.19 |
| Fibonacci | 59.48 | 61.70 | 63.07 | 65.29 | 67.51 | 68.88 | 71.10 |
Numerical data
The following is the status of technical indicators and moving averages registered at the time this technical analysis was created:
| RSI (14): | 66.12 | |
| MACD (12,26,9): | 0.6600 | |
| Directional Movement: | 20.34 | |
| AROON (14): | 64.29 | |
| DEMA (21): | 68.80 | |
| Parabolic SAR (0,02-0,02-0,2): | 69.28 | |
| Elder Ray (13): | 0.24 | |
| Super Trend (3,10): | 67.69 | |
| Zig ZAG (10): | 68.46 | |
| VORTEX (21): | 1.1800 | |
| Stochastique (14,3,5): | 61.11 | |
| TEMA (21): | 69.00 | |
| Williams %R (14): | -39.91 | |
| Chande Momentum Oscillator (20): | 1.09 | |
| Repulse (5,40,3): | -0.3700 | |
| ROCnROLL: | 1 | |
| TRIX (15,9): | 0.1600 | |
| Courbe Coppock: | 4.37 |
| MA7: | 66.57 | |
| MA20: | 65.40 | |
| MA50: | 67.26 | |
| MA100: | 67.78 | |
| MAexp7: | 68.48 | |
| MAexp20: | 67.91 | |
| MAexp50: | 66.89 | |
| MAexp100: | 66.24 | |
| Price / MA7: | +2.70% | |
| Price / MA20: | +4.54% | |
| Price / MA50: | +1.65% | |
| Price / MA100: | +0.87% | |
| Price / MAexp7: | -0.16% | |
| Price / MAexp20: | +0.68% | |
| Price / MAexp50: | +2.21% | |
| Price / MAexp100: | +3.22% |
News
Don't forget to follow the news on COGNIZANT TECHNOLOGY SOLUTIONS. At the time of publication of this analysis, the latest news was as follows:
- COGNIZANT REPORTS THIRD QUARTER 2023 RESULTS
- Cognizant Launches Synapse Initiative to Provide Job Training to One Million Individuals Around the Globe
- Technicolor Creative Studios selects Cognizant as its IT & Digital Transformation Partner
- Technicolor Creative Studios selects Cognizant as its IT & Digital Transformation Partner
- Technicolor Creative Studios selects Cognizant as its IT & Digital Transformation Partner
About author
Online


Add a comment
Comments
0 comments on the analysis COGNIZANT TECHNOLOGY SOLUTIONS - 1H