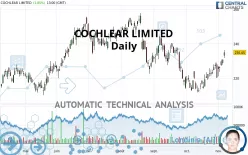
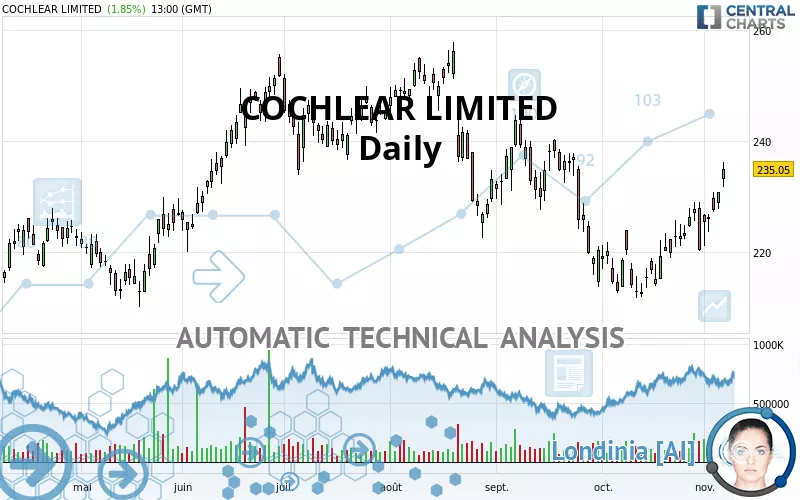
COCHLEAR LIMITED - Daily - Technical analysis published on 11/06/2021 (GMT)
- 212
- 0
Click here for a new analysis!
- Timeframe : Daily
- - Analysis generated on
- Status : INVALID
Summary of the analysis

Additional analysis
Quotes
The COCHLEAR LIMITED rating is 235.050 AUD. The price has increased by +1.86% since the last closing and was traded between 231.770 AUD and 236.140 AUD over the period. The price is currently at +1.42% from its lowest and -0.46% from its highest.A study of price movements over other periods shows the following variations:
Near a new HIGH record (1 month)
Type : Bullish
Timeframe : Weekly
Technical
A technical analysis in Daily of this COCHLEAR LIMITED chart shows a slightly bullish trend. Only 57.14% of the signals given by moving averages are bullish. This slightly bullish trend is reinforced by the strong signals currently being given by short-term moving averages. The Central Indicators market scanner is currently detecting a bullish signal that could impact this trend:
Bullish trend reversal : adaptative moving average 50
Type : Bullish
Timeframe : Daily
In fact, 14 technical indicators on 18 studied are currently positioned bullish. Caution: the Central Indicators scanner currently detects an excess:
CCI indicator is overbought : over 100
Type : Neutral
Timeframe : Daily
Williams %R indicator is overbought : over -20
Type : Neutral
Timeframe : Daily
Pivot points : price is over resistance 1
Type : Neutral
Timeframe : Daily
Pivot points : price is over resistance 1
Type : Neutral
Timeframe : Weekly
MACD indicator is back over 0
Type : Bullish
Timeframe : Daily
Price is back under the pivot point
Type : Bearish
Timeframe : Daily
An analysis of the price chart with the Central Patterns scanner (detector of chart patterns and resistances and supports) shows a result that can have an impact on the price change:
Resistance of channel is broken
Type : Bullish
Timeframe : Daily
The Central Candlesticks scanner which studies Japanese candlesticks did not detect anything.
| S3 | S2 | S1 | Price | R1 | R2 | R3 | |
|---|---|---|---|---|---|---|---|
| ProTrendLines | 212.774 | 218.930 | 227.850 | 235.050 | 238.520 | 243.592 | 251.574 |
| Change (%) | -9.48% | -6.86% | -3.06% | - | +1.48% | +3.63% | +7.03% |
| Change | -22.276 | -16.120 | -7.200 | - | +3.470 | +8.542 | +16.524 |
| Level | Major | Major | Minor | - | Major | Minor | Major |
Attention could also be paid to pivot points to set price objectives:
| Pivot points | S3 | S2 | S1 | PP | R1 | R2 | R3 |
|---|---|---|---|---|---|---|---|
| Standard | 228.130 | 229.950 | 232.500 | 234.320 | 236.870 | 238.690 | 241.240 |
| Camarilla | 233.848 | 234.249 | 234.649 | 235.050 | 235.451 | 235.851 | 236.252 |
| Woodie | 228.495 | 230.133 | 232.865 | 234.503 | 237.235 | 238.873 | 241.605 |
| Fibonacci | 229.950 | 231.619 | 232.651 | 234.320 | 235.989 | 237.021 | 238.690 |
| Pivot points | S3 | S2 | S1 | PP | R1 | R2 | R3 |
|---|---|---|---|---|---|---|---|
| Standard | 210.397 | 215.763 | 225.407 | 230.773 | 240.417 | 245.783 | 255.427 |
| Camarilla | 230.922 | 232.298 | 233.674 | 235.050 | 236.426 | 237.802 | 239.178 |
| Woodie | 212.535 | 216.833 | 227.545 | 231.843 | 242.555 | 246.853 | 257.565 |
| Fibonacci | 215.763 | 221.497 | 225.040 | 230.773 | 236.507 | 240.050 | 245.783 |
| Pivot points | S3 | S2 | S1 | PP | R1 | R2 | R3 |
|---|---|---|---|---|---|---|---|
| Standard | 194.617 | 203.233 | 211.837 | 220.453 | 229.057 | 237.673 | 246.277 |
| Camarilla | 215.705 | 217.283 | 218.862 | 220.440 | 222.019 | 223.597 | 225.176 |
| Woodie | 194.610 | 203.230 | 211.830 | 220.450 | 229.050 | 237.670 | 246.270 |
| Fibonacci | 203.233 | 209.811 | 213.875 | 220.453 | 227.031 | 231.095 | 237.673 |
Numerical data
The following are the details of the technical indicators and moving averages that were collected to generate this technical analysis:
| RSI (14): | 59.91 | |
| MACD (12,26,9): | 0.8290 | |
| Directional Movement: | 3.595 | |
| AROON (14): | 85.714 | |
| DEMA (21): | 223.853 | |
| Parabolic SAR (0,02-0,02-0,2): | 221.839 | |
| Elder Ray (13): | 4.699 | |
| Super Trend (3,10): | 215.250 | |
| Zig ZAG (10): | 230.770 | |
| VORTEX (21): | 1.0730 | |
| Stochastique (14,3,5): | 87.42 | |
| TEMA (21): | 227.443 | |
| Williams %R (14): | -0.71 | |
| Chande Momentum Oscillator (20): | 11.480 | |
| Repulse (5,40,3): | -0.0280 | |
| ROCnROLL: | 1 | |
| TRIX (15,9): | -0.0600 | |
| Courbe Coppock: | 9.48 |
| MA7: | 226.394 | |
| MA20: | 221.023 | |
| MA50: | 226.312 | |
| MA100: | 235.803 | |
| MAexp7: | 226.491 | |
| MAexp20: | 223.810 | |
| MAexp50: | 226.557 | |
| MAexp100: | 228.866 | |
| Price / MA7: | +3.82% | |
| Price / MA20: | +6.35% | |
| Price / MA50: | +3.86% | |
| Price / MA100: | -0.32% | |
| Price / MAexp7: | +3.78% | |
| Price / MAexp20: | +5.02% | |
| Price / MAexp50: | +3.75% | |
| Price / MAexp100: | +2.70% |
News
Don't forget to follow the news on COCHLEAR LIMITED. At the time of publication of this analysis, the latest news was as follows:
- Cochlear announces FDA approval and FDA clearance of first-of-its-kind Remote Care capabilities for Nucleus and Baha Systems
- 'The Incredible Hulk' Lou Ferrigno hears with a cochlear implant
- New Cochlear CoPilot app to help adults improve hearing outcomes through skills training
- Cochlear receives FDA clearance of Baha 6 Max, industry's smallest 55 dB sound processor now with direct Android streaming
- Cochlear welcomes landmark WHO report calling on governments and societies to prioritize hearing health
About author

Online


Add a comment
Comments
0 comments on the analysis COCHLEAR LIMITED - Daily