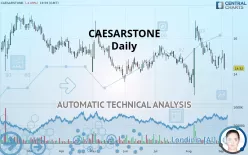
CAESARSTONE - Daily - Technical analysis published on 09/06/2019 (GMT)
- 243
- 0
- Who voted?
Click here for a new analysis!
- Timeframe : Daily
- - Analysis generated on
- Status : INVALID

Summary of the analysis

Additional analysis
Quotes
CAESARSTONE rating 14.32 USD. On the day, this instrument lost -4.09% and was traded between 14.21 USD and 15.16 USD over the period. The price is currently at +0.77% from its lowest and -5.54% from its highest.Here is a more detailed summary of the historical variations registered by CAESARSTONE:
Technical
A technical analysis in Daily of this CAESARSTONE chart shows a sharp bearish trend. The signals given by moving averages are 82.14% bearish. This strong bearish trend is confirmed by the strong signals currently being given by short-term moving averages. An assessment of moving averages reveals a bullish signal that could impact this trend:
Bullish price crossover with Moving Average 100
Type : Bullish
Timeframe : Daily
Technical indicators are bearish. There is still some doubt about the decline in the price.
Central Indicators, the scanner specialised in technical indicators, has identified these signals:
Pivot points : price is under support 1
Type : Neutral
Timeframe : Weekly
Pivot points : price is under support 3
Type : Neutral
Timeframe : Daily
Ichimoku : price is over the cloud
Type : Bullish
Timeframe : Daily
Ichimoku - Bearish crossover : Tenkan & Kijun
Type : Bearish
Timeframe : Daily
Price is back over the pivot point
Type : Bullish
Timeframe : Weekly
An analysis of the price chart with the Central Patterns scanner (detector of chart patterns and resistances and supports) shows a result that can have an impact on the price change:
Support of triangle is broken
Type : Bearish
Timeframe : Daily
No result was found by the Central Candlesticks scanner on Japanese candlesticks.
| S2 | S1 | Price | R1 | R2 | R3 | |
|---|---|---|---|---|---|---|
| ProTrendLines | 12.71 | 13.87 | 14.32 | 14.66 | 15.53 | 16.57 |
| Change (%) | -11.24% | -3.14% | - | +2.37% | +8.45% | +15.71% |
| Change | -1.61 | -0.45 | - | +0.34 | +1.21 | +2.25 |
| Level | Major | Intermediate | - | Intermediate | Major | Intermediate |
To determine price objectives, it is also possible to use the pivot points. Here is the price position in relation to pivot points:
| Pivot points | S3 | S2 | S1 | PP | R1 | R2 | R3 |
|---|---|---|---|---|---|---|---|
| Standard | 14.24 | 14.54 | 14.74 | 15.04 | 15.24 | 15.54 | 15.74 |
| Camarilla | 14.79 | 14.84 | 14.88 | 14.93 | 14.98 | 15.02 | 15.07 |
| Woodie | 14.18 | 14.52 | 14.68 | 15.02 | 15.18 | 15.52 | 15.68 |
| Fibonacci | 14.54 | 14.73 | 14.85 | 15.04 | 15.23 | 15.35 | 15.54 |
| Pivot points | S3 | S2 | S1 | PP | R1 | R2 | R3 |
|---|---|---|---|---|---|---|---|
| Standard | 13.75 | 14.01 | 14.50 | 14.76 | 15.25 | 15.51 | 16.00 |
| Camarilla | 14.78 | 14.85 | 14.92 | 14.99 | 15.06 | 15.13 | 15.20 |
| Woodie | 13.87 | 14.07 | 14.62 | 14.82 | 15.37 | 15.57 | 16.12 |
| Fibonacci | 14.01 | 14.30 | 14.47 | 14.76 | 15.05 | 15.22 | 15.51 |
| Pivot points | S3 | S2 | S1 | PP | R1 | R2 | R3 |
|---|---|---|---|---|---|---|---|
| Standard | 8.68 | 10.74 | 12.87 | 14.93 | 17.06 | 19.12 | 21.25 |
| Camarilla | 13.84 | 14.22 | 14.61 | 14.99 | 15.37 | 15.76 | 16.14 |
| Woodie | 8.71 | 10.76 | 12.90 | 14.95 | 17.09 | 19.14 | 21.28 |
| Fibonacci | 10.74 | 12.34 | 13.33 | 14.93 | 16.53 | 17.52 | 19.12 |
Numerical data
The following are the details of the technical indicators and moving averages that were collected to generate this technical analysis:
| RSI (14): | 41.81 | |
| MACD (12,26,9): | -0.0900 | |
| Directional Movement: | -7.40 | |
| AROON (14): | -71.43 | |
| DEMA (21): | 14.83 | |
| Parabolic SAR (0,02-0,02-0,2): | 16.74 | |
| Elder Ray (13): | -0.17 | |
| Super Trend (3,10): | 14.31 | |
| Zig ZAG (10): | 14.32 | |
| VORTEX (21): | 0.9800 | |
| Stochastique (14,3,5): | 28.26 | |
| TEMA (21): | 14.69 | |
| Williams %R (14): | -92.95 | |
| Chande Momentum Oscillator (20): | -1.18 | |
| Repulse (5,40,3): | -7.5700 | |
| ROCnROLL: | 2 | |
| TRIX (15,9): | 0.0000 | |
| Courbe Coppock: | 10.81 |
| MA7: | 14.69 | |
| MA20: | 15.22 | |
| MA50: | 14.96 | |
| MA100: | 14.91 | |
| MAexp7: | 14.74 | |
| MAexp20: | 14.91 | |
| MAexp50: | 14.93 | |
| MAexp100: | 15.04 | |
| Price / MA7: | -2.52% | |
| Price / MA20: | -5.91% | |
| Price / MA50: | -4.28% | |
| Price / MA100: | -3.96% | |
| Price / MAexp7: | -2.85% | |
| Price / MAexp20: | -3.96% | |
| Price / MAexp50: | -4.09% | |
| Price / MAexp100: | -4.79% |
News
Don"t forget to follow the news on CAESARSTONE. At the time of publication of this analysis, the latest news was as follows:
- Caesarstone Ltd. to Host Earnings Call
- Caesarstone, Luxury Quartz Surface Manufacturer, Featured In Traditional Home 2017 Southern Style Now Showhouse
- Caesarstone Ltd. to Host Earnings Call
- Investor Network: Caesarstone Ltd. to Host Earnings Call
- Luxury Quartz Surface Manufacturer, Caesarstone, Expands Entire Color Portfolio To All Nebraska Furniture Mart Locations
About author

Online


Add a comment
Comments
0 comments on the analysis CAESARSTONE - Daily