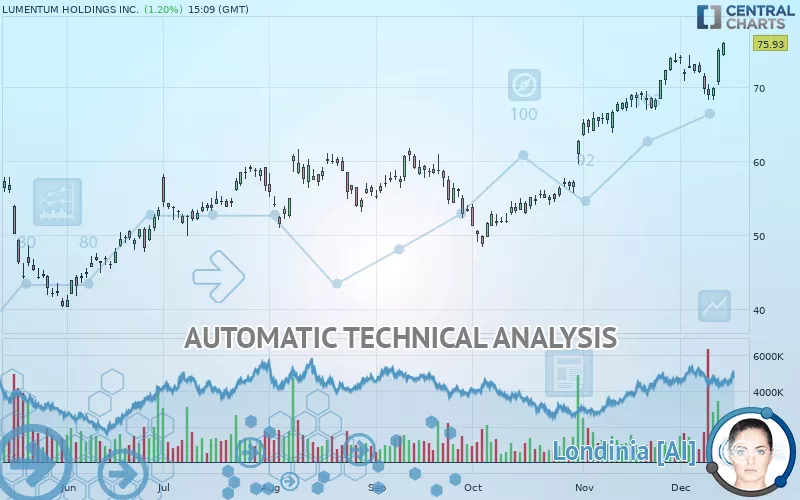
LUMENTUM HOLDINGS INC. - Daily - Technical analysis published on 12/13/2019 (GMT)
- 359
- 0
- Who voted?
Click here for a new analysis!
- Timeframe : Daily
- - Analysis generated on
- Status : TARGET REACHED

Summary of the analysis

Additional analysis
Quotes
The LUMENTUM HOLDINGS INC. price is 75.93 USD. On the day, this instrument gained +1.20% and was traded between 74.20 USD and 76.09 USD over the period. The price is currently at +2.33% from its lowest and -0.21% from its highest.The Central Gaps scanner detects a bearish opening. A small advantage for sellers in the very short term.
Bearish opening
Type : Bearish
Timeframe : Openning
So that you have an overall view of the price change, here is a table showing the variations over several periods:
Near a new HIGH record (1 year)
Type : Bullish
Timeframe : Weekly
Near a new HIGH record (1st january)
Type : Bullish
Timeframe : Weekly
Near a new HIGH record (1 month)
Type : Bullish
Timeframe : Weekly
Technical
Technical analysis of LUMENTUM HOLDINGS INC. in Daily shows a strongly overall bullish trend. 92.86% of the signals given by moving averages are bullish. The overall trend is supported by the strong bullish signals from short-term moving averages. An assessment of moving averages reveals several bullish signals that could impact this trend:
Bullish price crossover with Moving Average 20
Type : Bullish
Timeframe : Daily
Bullish price crossover with adaptative moving average 20
Type : Bullish
Timeframe : Daily
In fact, 14 technical indicators on 18 studied are currently bullish. Caution: the Central Indicators scanner currently detects an excess:
Williams %R indicator is overbought : over -20
Type : Neutral
Timeframe : Daily
Pivot points : price is over resistance 1
Type : Neutral
Timeframe : Weekly
Parabolic SAR indicator bullish reversal
Type : Bullish
Timeframe : Daily
Price is back over the pivot point
Type : Bullish
Timeframe : Daily
Price is back under the pivot point
Type : Bearish
Timeframe : Weekly
Williams %R indicator is back over -50
Type : Bullish
Timeframe : Daily
Central Patterns, the market scanner focusing on chart patterns, resistances and supports found this result:
Near resistance of channel
Type : Bearish
Timeframe : Daily
The presence of a bullish Japanese candlestick pattern detected by Central Candlesticks that could cause a very short term rebound was also detected:
Upside gap
Type : Bullish
Timeframe : Daily
| S3 | S2 | S1 | Price | |
|---|---|---|---|---|
| ProTrendLines | 60.74 | 67.95 | 73.20 | 75.93 |
| Change (%) | -20.01% | -10.51% | -3.60% | - |
| Change | -15.19 | -7.98 | -2.73 | - |
| Level | Major | Intermediate | Major | - |
To determine price objectives, it is also possible to use the pivot points. Here is the price position in relation to pivot points:
| Pivot points | S3 | S2 | S1 | PP | R1 | R2 | R3 |
|---|---|---|---|---|---|---|---|
| Standard | 66.61 | 68.42 | 71.72 | 73.53 | 76.83 | 78.64 | 81.94 |
| Camarilla | 73.63 | 74.09 | 74.56 | 75.03 | 75.50 | 75.97 | 76.44 |
| Woodie | 67.37 | 68.79 | 72.48 | 73.90 | 77.59 | 79.01 | 82.70 |
| Fibonacci | 68.42 | 70.37 | 71.58 | 73.53 | 75.48 | 76.69 | 78.64 |
| Pivot points | S3 | S2 | S1 | PP | R1 | R2 | R3 |
|---|---|---|---|---|---|---|---|
| Standard | 66.91 | 68.88 | 70.48 | 72.44 | 74.04 | 76.01 | 77.61 |
| Camarilla | 71.10 | 71.43 | 71.75 | 72.08 | 72.41 | 72.73 | 73.06 |
| Woodie | 66.73 | 68.79 | 70.30 | 72.35 | 73.86 | 75.92 | 77.43 |
| Fibonacci | 68.88 | 70.24 | 71.08 | 72.44 | 73.80 | 74.65 | 76.01 |
| Pivot points | S3 | S2 | S1 | PP | R1 | R2 | R3 |
|---|---|---|---|---|---|---|---|
| Standard | 55.32 | 59.34 | 66.50 | 70.52 | 77.68 | 81.70 | 88.86 |
| Camarilla | 70.59 | 71.61 | 72.64 | 73.66 | 74.69 | 75.71 | 76.73 |
| Woodie | 56.89 | 60.13 | 68.07 | 71.31 | 79.25 | 82.49 | 90.43 |
| Fibonacci | 59.34 | 63.61 | 66.25 | 70.52 | 74.79 | 77.43 | 81.70 |
Numerical data
The following is the status of the technical indicators and moving averages at the time of publication of this technical analysis:
| RSI (14): | 65.99 | |
| MACD (12,26,9): | 2.3200 | |
| Directional Movement: | 18.19 | |
| AROON (14): | 92.86 | |
| DEMA (21): | 73.96 | |
| Parabolic SAR (0,02-0,02-0,2): | 68.25 | |
| Elder Ray (13): | 2.91 | |
| Super Trend (3,10): | 68.29 | |
| Zig ZAG (10): | 75.08 | |
| VORTEX (21): | 1.1300 | |
| Stochastique (14,3,5): | 77.94 | |
| TEMA (21): | 73.81 | |
| Williams %R (14): | -1.59 | |
| Chande Momentum Oscillator (20): | 3.12 | |
| Repulse (5,40,3): | 6.7200 | |
| ROCnROLL: | 1 | |
| TRIX (15,9): | 0.6000 | |
| Courbe Coppock: | 8.59 |
| MA7: | 71.81 | |
| MA20: | 71.11 | |
| MA50: | 63.61 | |
| MA100: | 60.20 | |
| MAexp7: | 72.53 | |
| MAexp20: | 70.52 | |
| MAexp50: | 65.84 | |
| MAexp100: | 61.61 | |
| Price / MA7: | +5.74% | |
| Price / MA20: | +6.78% | |
| Price / MA50: | +19.37% | |
| Price / MA100: | +26.13% | |
| Price / MAexp7: | +4.69% | |
| Price / MAexp20: | +7.67% | |
| Price / MAexp50: | +15.33% | |
| Price / MAexp100: | +23.24% |
News
The last news published on LUMENTUM HOLDINGS INC. at the time of the generation of this analysis was as follows:
- Lumentum Holdings Inc. Announces Pricing of $900 Million Convertible Notes Offering
- Lumentum Holdings Inc. Announces $850 Million Convertible Notes Offering
- Lumentum To Sell Certain Product Lines to AFR
- Lumentum to Participate in Upcoming Investor Conferences
- Lumentum to Participate in the Needham Security, Networking, & Communications Conference
About author

Online


Add a comment
Comments
0 comments on the analysis LUMENTUM HOLDINGS INC. - Daily