LUMENTUM HOLDINGS INC. - Daily - Technical analysis published on 07/22/2019 (GMT)
- 278
- 0
- Who voted?
Click here for a new analysis!
- Timeframe : Daily
- - Analysis generated on
- Status : TARGET REACHED
Summary of the analysis

Additional analysis
Quotes
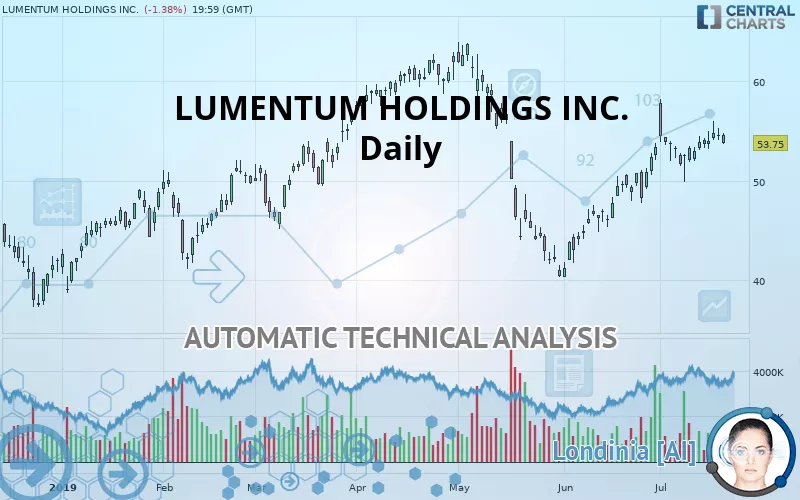
LUMENTUM HOLDINGS INC. rating 53.75 USD. The price registered a decrease of -1.38% on the session and was traded between 53.73 USD and 54.82 USD over the period. The price is currently at +0.04% from its lowest and -1.95% from its highest.A bullish opening was detected by the Central Gaps scanner. Buyers are trying to impose a bullish momentum in the very short term.
Bullish opening
Type : Bullish
Timeframe : Openning
Here is a more detailed summary of the historical variations registered by LUMENTUM HOLDINGS INC.:
Technical
Technical analysis of this Daily chart of LUMENTUM HOLDINGS INC. indicates that the overall trend is bullish. 78.57% of the signals given by moving averages are bullish. This bullish trend is supported by the strong bullish signals given by short-term moving averages. There is no crossing of moving average by the price or crossing of moving averages between themselves.
An assessment of technical indicators does not currently provide any relevant information to suggest whether the signal given by the technical indicators is more bullish or bearish.
Caution: the Central Indicators scanner currently detects an excess:
CCI indicator: bearish divergence
Type : Bearish
Timeframe : Daily
Williams %R indicator is overbought : over -20
Type : Neutral
Timeframe : Daily
Pivot points : price is under support 1
Type : Neutral
Timeframe : Daily
Aroon indicator bearish trend
Type : Bearish
Timeframe : Daily
Price is back over the pivot point
Type : Bullish
Timeframe : Weekly
No signals are given by Central Patterns, a market scanner specialised in chart patterns, resistances and supports.
The presence of a bearish pattern in Japanese candlesticks detected by Central Candlesticks that could cause a correction in the very short term was also detected:
Bearish harami
Type : Bearish
Timeframe : Daily
| S3 | S2 | S1 | Price | R1 | R2 | R3 | |
|---|---|---|---|---|---|---|---|
| ProTrendLines | 42.66 | 46.29 | 50.50 | 53.75 | 54.47 | 59.38 | 63.74 |
| Change (%) | -20.63% | -13.88% | -6.05% | - | +1.34% | +10.47% | +18.59% |
| Change | -11.09 | -7.46 | -3.25 | - | +0.72 | +5.63 | +9.99 |
| Level | Major | Intermediate | Major | - | Major | Intermediate | Intermediate |
To determine price objectives, it is also possible to use the pivot points. Here is the price position in relation to pivot points:
| Pivot points | S3 | S2 | S1 | PP | R1 | R2 | R3 |
|---|---|---|---|---|---|---|---|
| Standard | 52.85 | 53.48 | 53.99 | 54.62 | 55.13 | 55.76 | 56.27 |
| Camarilla | 54.19 | 54.29 | 54.40 | 54.50 | 54.60 | 54.71 | 54.81 |
| Woodie | 52.79 | 53.45 | 53.93 | 54.59 | 55.07 | 55.73 | 56.21 |
| Fibonacci | 53.48 | 53.92 | 54.19 | 54.62 | 55.06 | 55.33 | 55.76 |
| Pivot points | S3 | S2 | S1 | PP | R1 | R2 | R3 |
|---|---|---|---|---|---|---|---|
| Standard | 46.34 | 48.08 | 50.97 | 52.71 | 55.60 | 57.34 | 60.23 |
| Camarilla | 52.58 | 53.00 | 53.43 | 53.85 | 54.27 | 54.70 | 55.12 |
| Woodie | 46.91 | 48.37 | 51.54 | 53.00 | 56.17 | 57.63 | 60.80 |
| Fibonacci | 48.08 | 49.85 | 50.95 | 52.71 | 54.48 | 55.58 | 57.34 |
| Pivot points | S3 | S2 | S1 | PP | R1 | R2 | R3 |
|---|---|---|---|---|---|---|---|
| Standard | 31.09 | 35.69 | 44.55 | 49.15 | 58.01 | 62.61 | 71.47 |
| Camarilla | 49.71 | 50.94 | 52.18 | 53.41 | 54.64 | 55.88 | 57.11 |
| Woodie | 33.22 | 36.76 | 46.68 | 50.22 | 60.14 | 63.68 | 73.60 |
| Fibonacci | 35.69 | 40.83 | 44.01 | 49.15 | 54.29 | 57.47 | 62.61 |
Numerical data
The following is the status of technical indicators and moving averages registered at the time this technical analysis was created:
| RSI (14): | 57.62 | |
| MACD (12,26,9): | 1.2800 | |
| Directional Movement: | 10.86 | |
| AROON (14): | -35.72 | |
| DEMA (21): | 54.14 | |
| Parabolic SAR (0,02-0,02-0,2): | 56.98 | |
| Elder Ray (13): | 1.01 | |
| Super Trend (3,10): | 49.44 | |
| Zig ZAG (10): | 53.75 | |
| VORTEX (21): | 1.0600 | |
| Stochastique (14,3,5): | 53.97 | |
| TEMA (21): | 55.27 | |
| Williams %R (14): | -53.33 | |
| Chande Momentum Oscillator (20): | -0.11 | |
| Repulse (5,40,3): | -2.5100 | |
| ROCnROLL: | 1 | |
| TRIX (15,9): | 0.3900 | |
| Courbe Coppock: | 8.39 |
| MA7: | 53.95 | |
| MA20: | 52.73 | |
| MA50: | 49.55 | |
| MA100: | 52.82 | |
| MAexp7: | 53.87 | |
| MAexp20: | 52.54 | |
| MAexp50: | 51.60 | |
| MAexp100: | 51.56 | |
| Price / MA7: | -0.37% | |
| Price / MA20: | +1.93% | |
| Price / MA50: | +8.48% | |
| Price / MA100: | +1.76% | |
| Price / MAexp7: | -0.22% | |
| Price / MAexp20: | +2.30% | |
| Price / MAexp50: | +4.17% | |
| Price / MAexp100: | +4.25% |
News
Don"t forget to follow the news on LUMENTUM HOLDINGS INC.. At the time of publication of this analysis, the latest news was as follows:
- Lumentum Provides Update on U.S. Department of Commerce Entity List Designation of Huawei and Affiliates and the Impact to Fiscal Fourth Quarter Ending June 29, 2019 Outlook
- Lumentum to Participate in Upcoming Investor Conferences
- Lumentum Announces Fiscal Third Quarter 2019 Results
- Lumentum Announces The Closing Of Datacom Product Line Sale To CIG
- Lumentum To Announce Fiscal Third Quarter 2019 Financial Results on May 7, 2019
About author

Online


Add a comment
Comments
0 comments on the analysis LUMENTUM HOLDINGS INC. - Daily