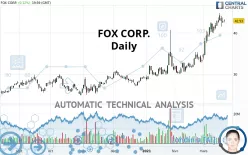
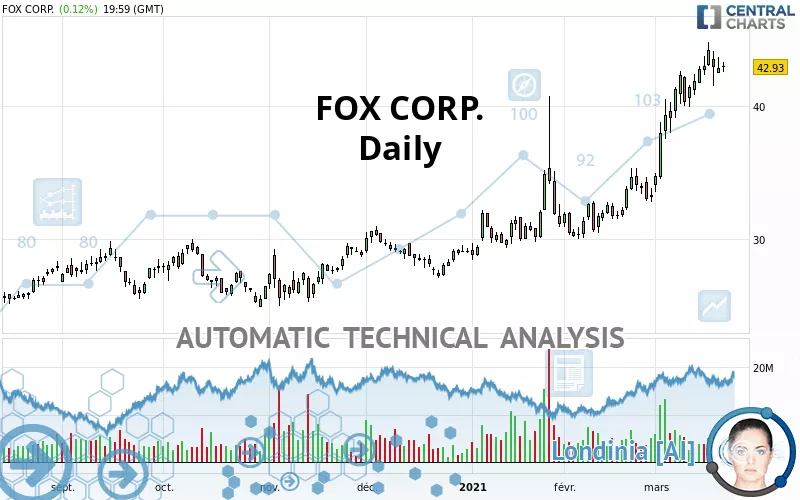
FOX CORP. - Daily - Technical analysis published on 03/20/2021 (GMT)
- 351
- 0
- Timeframe : Daily
- - Analysis generated on
- Status : WITHOUT TARGET
Summary of the analysis

Additional analysis
Quotes
The FOX CORP. rating is 42.92 USD. The price has increased by +0.09% since the last closing and was between 42.57 USD and 43.31 USD. This implies that the price is at +0.82% from its lowest and at -0.90% from its highest.The Central Gaps scanner detects a bullish opening marking the presence of buyers ahead of sellers at the opening but not sufficiently marked to allow the price to register a quotation gap.
Bullish opening
Type : Bullish
Timeframe : Openning
Here is a more detailed summary of the historical variations registered by FOX CORP.:
Near a new HIGH record (1 year)
Type : Bullish
Timeframe : Weekly
Near a new HIGH record (1st january)
Type : Bullish
Timeframe : Weekly
Near a new HIGH record (1 month)
Type : Bullish
Timeframe : Weekly
Technical
Technical analysis of this Daily chart of FOX CORP. indicates that the overall trend is strongly bullish. The signals given by the moving averages are 92.86% bullish. This strong bullish trend is confirmed by the strong signals currently being given by short-term moving averages. The Central Indicators scanner does not detect any result on moving averages that would impact this trend.
In fact, 11 technical indicators on 18 studied are currently positioned bullish. But beware of excesses. The Central Indicators scanner currently detects this:
CCI indicator: bearish divergence
Type : Bearish
Timeframe : Daily
RSI indicator: bearish divergence
Type : Bearish
Timeframe : Daily
Williams %R indicator is overbought : over -20
Type : Neutral
Timeframe : Daily
Pivot points : price is over resistance 2
Type : Neutral
Timeframe : Daily
Pivot points : price is over resistance 3
Type : Neutral
Timeframe : Weekly
Pivot points : price is under support 3
Type : Neutral
Timeframe : Daily
Central Patterns, the market scanner focusing on chart patterns, resistances and supports found these results:
Resistance of channel is broken
Type : Bullish
Timeframe : Daily
Horizontal support is broken
Type : Bearish
Timeframe : Daily
The Central Candlesticks scanner, specialised in Japanese candlesticks, did not identify any signals.
| S3 | S2 | S1 | Price | |
|---|---|---|---|---|
| ProTrendLines | 34.93 | 39.35 | 42.33 | 42.92 |
| Change (%) | -18.62% | -8.32% | -1.37% | - |
| Change | -7.99 | -3.57 | -0.59 | - |
| Level | Major | Intermediate | Major | - |
Pivot points can also be used to set your price objectives. Here is the price situation in relation to pivot points:
| Pivot points | S3 | S2 | S1 | PP | R1 | R2 | R3 |
|---|---|---|---|---|---|---|---|
| Standard | 41.82 | 42.19 | 42.56 | 42.93 | 43.30 | 43.67 | 44.04 |
| Camarilla | 42.72 | 42.78 | 42.85 | 42.92 | 42.99 | 43.06 | 43.12 |
| Woodie | 41.81 | 42.19 | 42.55 | 42.93 | 43.29 | 43.67 | 44.03 |
| Fibonacci | 42.19 | 42.48 | 42.65 | 42.93 | 43.22 | 43.39 | 43.67 |
| Pivot points | S3 | S2 | S1 | PP | R1 | R2 | R3 |
|---|---|---|---|---|---|---|---|
| Standard | 38.01 | 39.75 | 41.33 | 43.07 | 44.65 | 46.39 | 47.97 |
| Camarilla | 42.01 | 42.31 | 42.62 | 42.92 | 43.22 | 43.53 | 43.83 |
| Woodie | 37.94 | 39.71 | 41.26 | 43.03 | 44.58 | 46.35 | 47.90 |
| Fibonacci | 39.75 | 41.02 | 41.80 | 43.07 | 44.34 | 45.12 | 46.39 |
| Pivot points | S3 | S2 | S1 | PP | R1 | R2 | R3 |
|---|---|---|---|---|---|---|---|
| Standard | 25.08 | 27.56 | 30.43 | 32.91 | 35.78 | 38.26 | 41.13 |
| Camarilla | 31.84 | 32.33 | 32.82 | 33.31 | 33.80 | 34.29 | 34.78 |
| Woodie | 25.29 | 27.66 | 30.64 | 33.01 | 35.99 | 38.36 | 41.34 |
| Fibonacci | 27.56 | 29.60 | 30.86 | 32.91 | 34.95 | 36.21 | 38.26 |
Numerical data
The following are the details of the technical indicators and moving averages that were collected to generate this technical analysis:
| RSI (14): | 68.53 | |
| MACD (12,26,9): | 2.7700 | |
| Directional Movement: | 22.85 | |
| AROON (14): | 78.57 | |
| DEMA (21): | 43.39 | |
| Parabolic SAR (0,02-0,02-0,2): | 41.48 | |
| Elder Ray (13): | 1.65 | |
| Super Trend (3,10): | 38.34 | |
| Zig ZAG (10): | 42.92 | |
| VORTEX (21): | 1.2500 | |
| Stochastique (14,3,5): | 83.02 | |
| TEMA (21): | 44.48 | |
| Williams %R (14): | -18.24 | |
| Chande Momentum Oscillator (20): | 3.60 | |
| Repulse (5,40,3): | 0.8600 | |
| ROCnROLL: | 1 | |
| TRIX (15,9): | 1.1100 | |
| Courbe Coppock: | 45.10 |
| MA7: | 42.89 | |
| MA20: | 39.30 | |
| MA50: | 34.61 | |
| MA100: | 31.38 | |
| MAexp7: | 42.56 | |
| MAexp20: | 39.81 | |
| MAexp50: | 35.86 | |
| MAexp100: | 32.90 | |
| Price / MA7: | +0.07% | |
| Price / MA20: | +9.21% | |
| Price / MA50: | +24.01% | |
| Price / MA100: | +36.78% | |
| Price / MAexp7: | +0.85% | |
| Price / MAexp20: | +7.81% | |
| Price / MAexp50: | +19.69% | |
| Price / MAexp100: | +30.46% |
News
The latest news and videos published on FOX CORP. at the time of the analysis were as follows:
- 21st Century Fox and Disney Announce Distribution Adjustment Multiple in Connection with Acquisition and Effect on Outstanding Shares
- Fox Set to Join S&P 500; Adobe to Join S&P 100
- Option-trading opportunities on Twenty-First Century Fox Inc., Gds Holdings Ltd., Hewlett Packard Enterprise Co., Momo Inc., and ON Semiconductor Corp.
- New Research: Key Drivers of Growth for Twenty-First Century Fox, Royal Gold, NIC, PerkinElmer, Chimera Investment, and CorEnergy Infrastructure Trust — Factors of Influence, Major Initiatives and Sustained Production
- 21st Century Fox Reports Second Quarter Income From Continuing Operations Attributable to 21st Century Fox Stockholders of $10.83 Billion
About author

Online


Add a comment
Comments
0 comments on the analysis FOX CORP. - Daily