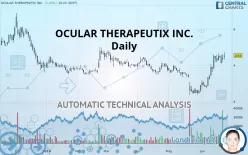
OCULAR THERAPEUTIX INC. - Daily - Technical analysis published on 06/24/2019 (GMT)
- 300
- 0
Click here for a new analysis!
- Timeframe : Daily
- - Analysis generated on
- Status : TARGET REACHED

Summary of the analysis

Additional analysis
Quotes
The OCULAR THERAPEUTIX INC. rating is 4.53 USD. The price has increased by +2.49% since the last closing and was between 4.31 USD and 4.74 USD. This implies that the price is at +5.10% from its lowest and at -4.43% from its highest.A bullish opening was detected by the Central Gaps scanner. Buyers are trying to impose a bullish momentum in the very short term.
Bullish opening
Type : Bullish
Timeframe : Openning
A study of price movements over other periods shows the following variations:
Abnormal volumes
Timeframe : 5 days
Technical
Technical analysis of this Daily chart of OCULAR THERAPEUTIX INC. indicates that the overall trend is bullish. 71.43% of the signals given by moving averages are bullish. This bullish trend shows slight signs of slowing down given the slightly bullish signals given by the short-term moving averages. An assessment of moving averages reveals a bullish signal that could impact this trend:
Moving Average bullish crossovers : AMA20 & AMA50
Type : Bullish
Timeframe : Daily
The probability of a further increase is high given the direction of the technical indicators.
Caution: the Central Indicators scanner currently detects an excess:
Williams %R indicator is overbought : over -20
Type : Neutral
Timeframe : Daily
Price is back over the pivot point
Type : Bullish
Timeframe : Daily
Price is back over the pivot point
Type : Bullish
Timeframe : Weekly
Central Patterns, the scanner specializing in chart patterns, did not identify any signals.
Central Candlesticks, the scanner specialised in Japanese candlesticks, detects a bullish signal that could support the hypothesis of a small rebound in the very short term:
Bullish harami
Type : Bullish
Timeframe : Daily
| S3 | S2 | S1 | Price | R1 | R2 | R3 | |
|---|---|---|---|---|---|---|---|
| ProTrendLines | 2.46 | 3.61 | 4.10 | 4.53 | 4.82 | 5.66 | 6.14 |
| Change (%) | -45.70% | -20.31% | -9.49% | - | +6.40% | +24.94% | +35.54% |
| Change | -2.07 | -0.92 | -0.43 | - | +0.29 | +1.13 | +1.61 |
| Level | Intermediate | Intermediate | Major | - | Major | Minor | Minor |
Pivot points can also be used to set your price objectives. Here is the price situation in relation to pivot points:
| Pivot points | S3 | S2 | S1 | PP | R1 | R2 | R3 |
|---|---|---|---|---|---|---|---|
| Standard | 3.72 | 3.95 | 4.18 | 4.41 | 4.64 | 4.87 | 5.10 |
| Camarilla | 4.29 | 4.34 | 4.38 | 4.42 | 4.46 | 4.50 | 4.55 |
| Woodie | 3.73 | 3.95 | 4.19 | 4.41 | 4.65 | 4.87 | 5.11 |
| Fibonacci | 3.95 | 4.12 | 4.23 | 4.41 | 4.58 | 4.69 | 4.87 |
| Pivot points | S3 | S2 | S1 | PP | R1 | R2 | R3 |
|---|---|---|---|---|---|---|---|
| Standard | 3.54 | 3.82 | 4.12 | 4.40 | 4.70 | 4.98 | 5.28 |
| Camarilla | 4.26 | 4.31 | 4.37 | 4.42 | 4.47 | 4.53 | 4.58 |
| Woodie | 3.55 | 3.83 | 4.13 | 4.41 | 4.71 | 4.99 | 5.29 |
| Fibonacci | 3.82 | 4.04 | 4.18 | 4.40 | 4.62 | 4.76 | 4.98 |
Numerical data
The following is the status of technical indicators and moving averages registered at the time this technical analysis was created:
| RSI (14): | 64.36 | |
| MACD (12,26,9): | 0.3200 | |
| Directional Movement: | 15.46 | |
| AROON (14): | 85.71 | |
| DEMA (21): | 4.21 | |
| Parabolic SAR (0,02-0,02-0,2): | 3.82 | |
| Elder Ray (13): | 0.46 | |
| Super Trend (3,10): | 3.37 | |
| Zig ZAG (10): | 4.60 | |
| VORTEX (21): | 1.1800 | |
| Stochastique (14,3,5): | 83.68 | |
| TEMA (21): | 4.56 | |
| Williams %R (14): | -7.92 | |
| Chande Momentum Oscillator (20): | 1.79 | |
| Repulse (5,40,3): | -0.5000 | |
| ROCnROLL: | 1 | |
| TRIX (15,9): | 0.7800 | |
| Courbe Coppock: | 111.72 |
| MA7: | 4.38 | |
| MA20: | 3.57 | |
| MA50: | 3.57 | |
| MA100: | 3.82 | |
| MAexp7: | 4.32 | |
| MAexp20: | 3.87 | |
| MAexp50: | 3.71 | |
| MAexp100: | 3.92 | |
| Price / MA7: | +3.42% | |
| Price / MA20: | +26.89% | |
| Price / MA50: | +26.89% | |
| Price / MA100: | +18.59% | |
| Price / MAexp7: | +4.86% | |
| Price / MAexp20: | +17.05% | |
| Price / MAexp50: | +22.10% | |
| Price / MAexp100: | +15.56% |
News
The last news published on OCULAR THERAPEUTIX INC. at the time of the generation of this analysis was as follows:
-
 Ocular Therapeutix, Inc. - OCUL Stock Chart Technical Analysis for 06-21-2019
-
Ocular Therapeutix, Inc. - OCUL Stock Chart Technical Analysis for 06-11-2019
-
Ocular Therapeutix, Inc. - OCUL Stock Chart Technical Analysis for 05-21-2019
- Ocular Therapeutix™ To Report Fourth Quarter and Year End 2018 Financial Results
-
Ocular Therapeutix, Inc. - OCUL Stock Chart Technical Analysis for 02-22-2019
About author

Online


Add a comment
Comments
0 comments on the analysis OCULAR THERAPEUTIX INC. - Daily