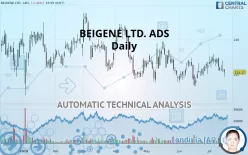
BEIGENE LTD. ADS - Daily - Technical analysis published on 07/17/2019 (GMT)
- 312
- 0
- Who voted?
Click here for a new analysis!
- Timeframe : Daily
- - Analysis generated on
- Status : INVALID

Summary of the analysis

Additional analysis
Quotes
The BEIGENE LTD. ADS price is 121.17 USD. On the day, this instrument lost -1.42% and was traded between 118.60 USD and 122.90 USD over the period. The price is currently at +2.17% from its lowest and -1.41% from its highest.The Central Gaps scanner detects a bullish opening marking the presence of sellers ahead of buyers at the opening but not sufficiently marked to allow the price to register a quotation gap.
Bearish opening
Type : Bearish
Timeframe : Openning
Here is a more detailed summary of the historical variations registered by BEIGENE LTD. ADS:
Near a new LOW record (1 month)
Type : Bearish
Timeframe : Weekly
Technical
A technical analysis in Daily of this BEIGENE LTD. ADS chart shows a sharp bearish trend. 89.29% of the signals given by moving averages are bearish. This strongly bearish trend is showing signs of slowing down given the slightly bearish signals given by short-term moving averages. The Central Indicators market scanner is currently detecting a bullish signal that could impact this trend:
Bullish trend reversal : Moving Average 20
Type : Bullish
Timeframe : Daily
Technical indicators are bearish. There is still some doubt about the decline in the price.
Central Indicators, the detector scanner for these technical indicators has recently detected several signals:
Parabolic SAR indicator bearish reversal
Type : Bearish
Timeframe : Daily
Price is back under the pivot point
Type : Bearish
Timeframe : Weekly
Momentum indicator is back under 0
Type : Bearish
Timeframe : Daily
The Central Patterns scanner, which studies chart patterns, resistances and supports, has identified this signal:
Near horizontal support
Type : Bullish
Timeframe : Daily
Central Candlesticks, the scanner specialised in Japanese candlesticks, detects this inversion signal that could impact the current short-term trend:
Doji
Type : Neutral
Timeframe : Daily
| S3 | S2 | S1 | Price | R1 | R2 | R3 | |
|---|---|---|---|---|---|---|---|
| ProTrendLines | 79.20 | 107.01 | 117.20 | 121.17 | 123.18 | 130.05 | 144.25 |
| Change (%) | -34.64% | -11.69% | -3.28% | - | +1.66% | +7.33% | +19.05% |
| Change | -41.97 | -14.16 | -3.97 | - | +2.01 | +8.88 | +23.08 |
| Level | Minor | Major | Major | - | Major | Intermediate | Minor |
Attention could also be paid to pivot points to set price objectives:
| Pivot points | S3 | S2 | S1 | PP | R1 | R2 | R3 |
|---|---|---|---|---|---|---|---|
| Standard | 113.98 | 117.65 | 120.28 | 123.95 | 126.58 | 130.25 | 132.88 |
| Camarilla | 121.18 | 121.76 | 122.33 | 122.91 | 123.49 | 124.07 | 124.64 |
| Woodie | 113.46 | 117.39 | 119.76 | 123.69 | 126.06 | 129.99 | 132.36 |
| Fibonacci | 117.65 | 120.06 | 121.54 | 123.95 | 126.36 | 127.84 | 130.25 |
| Pivot points | S3 | S2 | S1 | PP | R1 | R2 | R3 |
|---|---|---|---|---|---|---|---|
| Standard | 111.81 | 116.81 | 119.75 | 124.75 | 127.69 | 132.69 | 135.63 |
| Camarilla | 120.52 | 121.24 | 121.97 | 122.70 | 123.43 | 124.16 | 124.88 |
| Woodie | 110.79 | 116.30 | 118.73 | 124.24 | 126.67 | 132.18 | 134.61 |
| Fibonacci | 116.81 | 119.84 | 121.71 | 124.75 | 127.78 | 129.65 | 132.69 |
| Pivot points | S3 | S2 | S1 | PP | R1 | R2 | R3 |
|---|---|---|---|---|---|---|---|
| Standard | 98.33 | 105.67 | 114.81 | 122.15 | 131.29 | 138.63 | 147.77 |
| Camarilla | 119.42 | 120.93 | 122.44 | 123.95 | 125.46 | 126.97 | 128.48 |
| Woodie | 99.23 | 106.12 | 115.71 | 122.60 | 132.19 | 139.08 | 148.67 |
| Fibonacci | 105.67 | 111.97 | 115.86 | 122.15 | 128.45 | 132.34 | 138.63 |
Numerical data
The following is the status of technical indicators and moving averages registered at the time this technical analysis was created:
| RSI (14): | 44.09 | |
| MACD (12,26,9): | -0.0500 | |
| Directional Movement: | -1.59 | |
| AROON (14): | -50.00 | |
| DEMA (21): | 124.08 | |
| Parabolic SAR (0,02-0,02-0,2): | 131.48 | |
| Elder Ray (13): | -3.32 | |
| Super Trend (3,10): | 131.88 | |
| Zig ZAG (10): | 121.17 | |
| VORTEX (21): | 0.9700 | |
| Stochastique (14,3,5): | 25.54 | |
| TEMA (21): | 124.53 | |
| Williams %R (14): | -80.37 | |
| Chande Momentum Oscillator (20): | -4.49 | |
| Repulse (5,40,3): | -2.9100 | |
| ROCnROLL: | 2 | |
| TRIX (15,9): | 0.0500 | |
| Courbe Coppock: | 4.98 |
| MA7: | 124.30 | |
| MA20: | 123.85 | |
| MA50: | 124.36 | |
| MA100: | 129.14 | |
| MAexp7: | 123.55 | |
| MAexp20: | 124.07 | |
| MAexp50: | 125.01 | |
| MAexp100: | 127.95 | |
| Price / MA7: | -2.52% | |
| Price / MA20: | -2.16% | |
| Price / MA50: | -2.57% | |
| Price / MA100: | -6.17% | |
| Price / MAexp7: | -1.93% | |
| Price / MAexp20: | -2.34% | |
| Price / MAexp50: | -3.07% | |
| Price / MAexp100: | -5.30% |
News
Don"t forget to follow the news on BEIGENE LTD. ADS. At the time of publication of this analysis, the latest news was as follows:
- BeiGene Granted Approval to Transition from the Biotech Chapter of the Hong Kong Stock Exchange to a General Listing
- BeiGene Announces Phase 1b Clinical Results of Zanubrutinib in Combination with GAZYVA® (Obinutuzumab) in Patients with Chronic Lymphocytic Leukemia/Small Lymphocytic Lymphoma or Follicular Lymphoma at the 15th International Conference on Malignant Lymphoma (ICML)
- BeiGene Presents Pivotal Phase 2 Clinical Results of Zanubrutinib in Patients with Relapsed/Refractory Chronic Lymphocytic Leukemia or Small Lymphocytic Lymphoma at the 15th International Conference on Malignant Lymphoma (ICML)
- BeiGene Announces Updated Results from Two Ongoing Clinical Trials of Zanubrutinib in Patients with Mantle Cell Lymphoma in Presentations at the 15th International Conference on Malignant Lymphoma (ICML)
- BeiGene and SpringWorks Therapeutics Announce the Formation of MapKure to Develop BGB-3245, an Investigational, Selective Next-Generation RAF Kinase Inhibitor
About author

Online


Add a comment
Comments
0 comments on the analysis BEIGENE LTD. ADS - Daily